
Credit: istock SHansche
he aim of the London Energy Map project was to use data to build a clear picture of how much energy each building consumes in London, and therefore establish a specific 2050 building level target.
The project, funded by Etude, focused on using public datasets. The motivation behind this was both from a practical aspect of being able to access the data, and to allow our findings to be published openly.
We carried out a comprehensive review of the public datasets available1 that offer information on the energy consumption and building stock in London. A summary of the key databases used throughout our analysis are listed below.
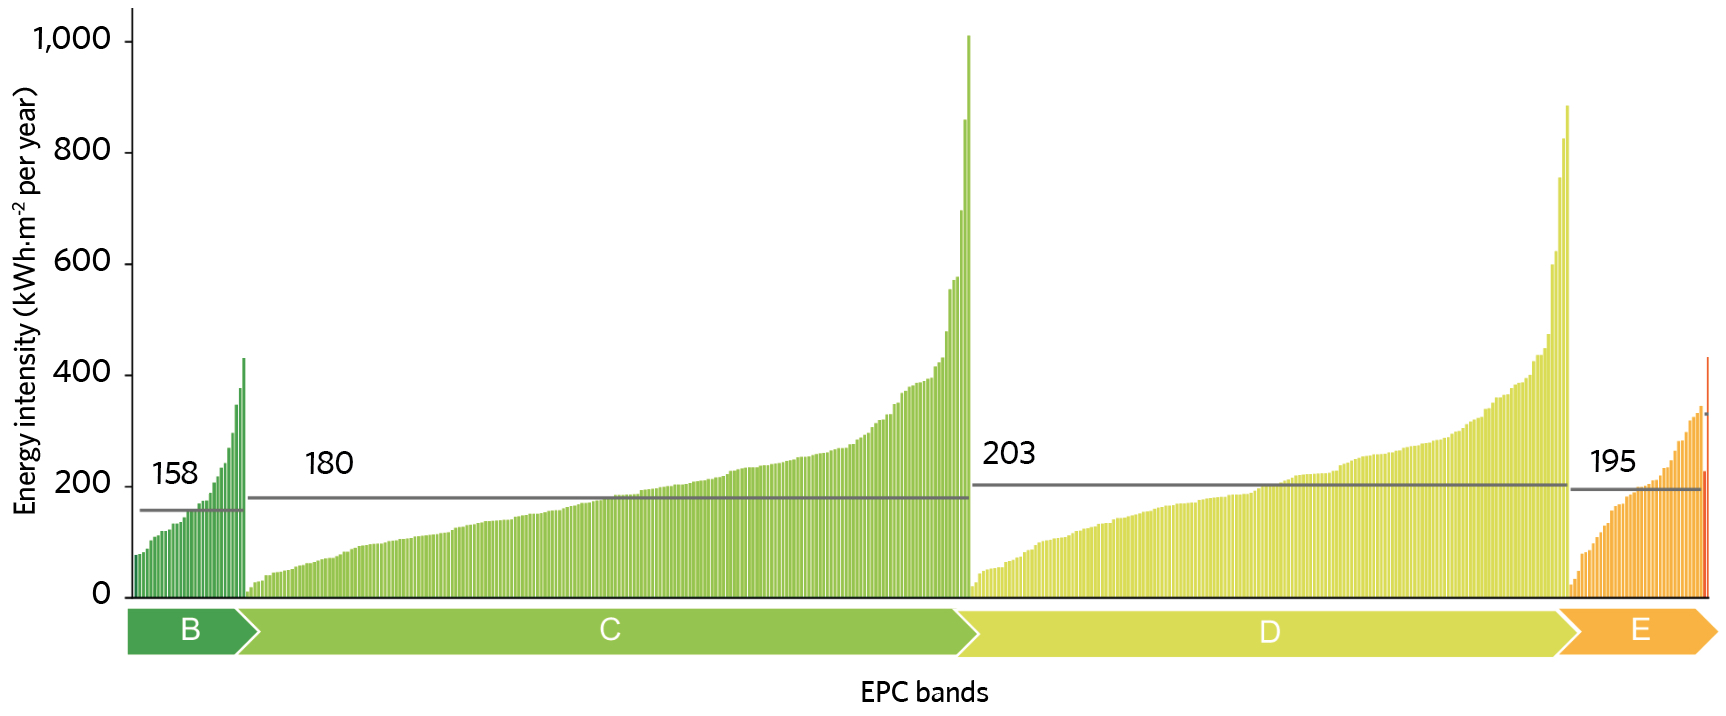
Figure 1: A comparison of the EPC energy efficiency rating with metered energy consumption of 420 homes shows huge variance in the energy consumed within each rating band
Real energy data is available on only 0.01% of the whole domestic stock. The National Energy Efficiency Data-framework (Need) run by the Department for Business, Energy and Industrial Strategy (BEIS) matches real energy consumption with property attributes and interventions to better understand effects of energy efficiency measures.
The Need team is doing much valuable work, but there has only been one publication of the anonymised data in 2014 (with updated public release data expected soon). It consisted of energy consumption data between 2005 and 2012 on a sample of 5,000 London homes. To ensure the anonymity of the households, the floor area was banded into large groups (for example, 50-100m2).
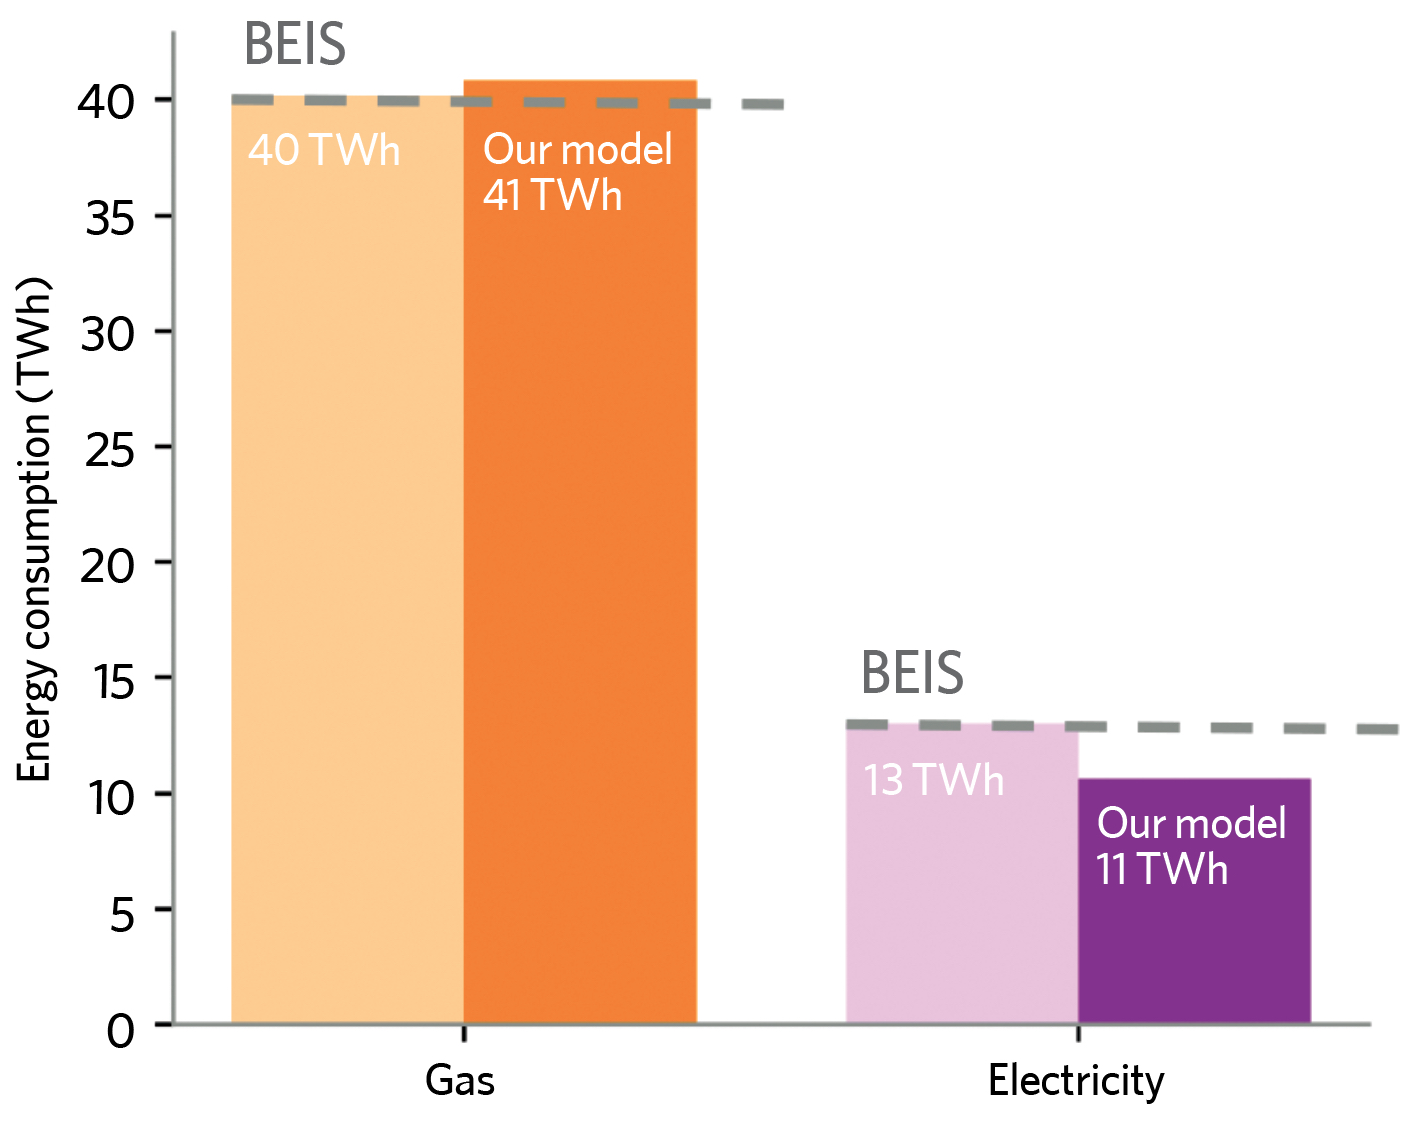
Figure 2: Estimates of total energy consumption from the predictive model are close to the report BEIS statistics
The dataset allows for some high-level interrogation of how different building characteristics correlate with energy consumption. This proved to be very useful in improving our understanding of which factors affect operational energy in existing dwellings.
Energy performance certificates (EPCs) cover almost half of London’s domestic building stock, but it is widely acknowledged that the EPC band rating system is a poor reflection of actual energy use. In reality, large variance exists at both ends within each band, and there is little difference in median energy use intensity between different bands, as illustrated in Figure 1.
We found the EPCs to be a comprehensive dataset for building stock information, but not as a source of energy data.
We created a new dataset by matching aggregated meter consumption with EPC certificates. Using BEIS’s postcode-level consumption statistics, we matched the median consumption of six-meter aggregations to the corresponding EPC certificates, using their postcodes.
This provided us with a new dataset of around 5,000 entries, consisting of real energy consumption with building information. This works on the assumption that dwellings on the same street are similar and therefore have similar energy consumptions. We acknowledge this is not strictly true, but it’s the best we have to fill the data gap.
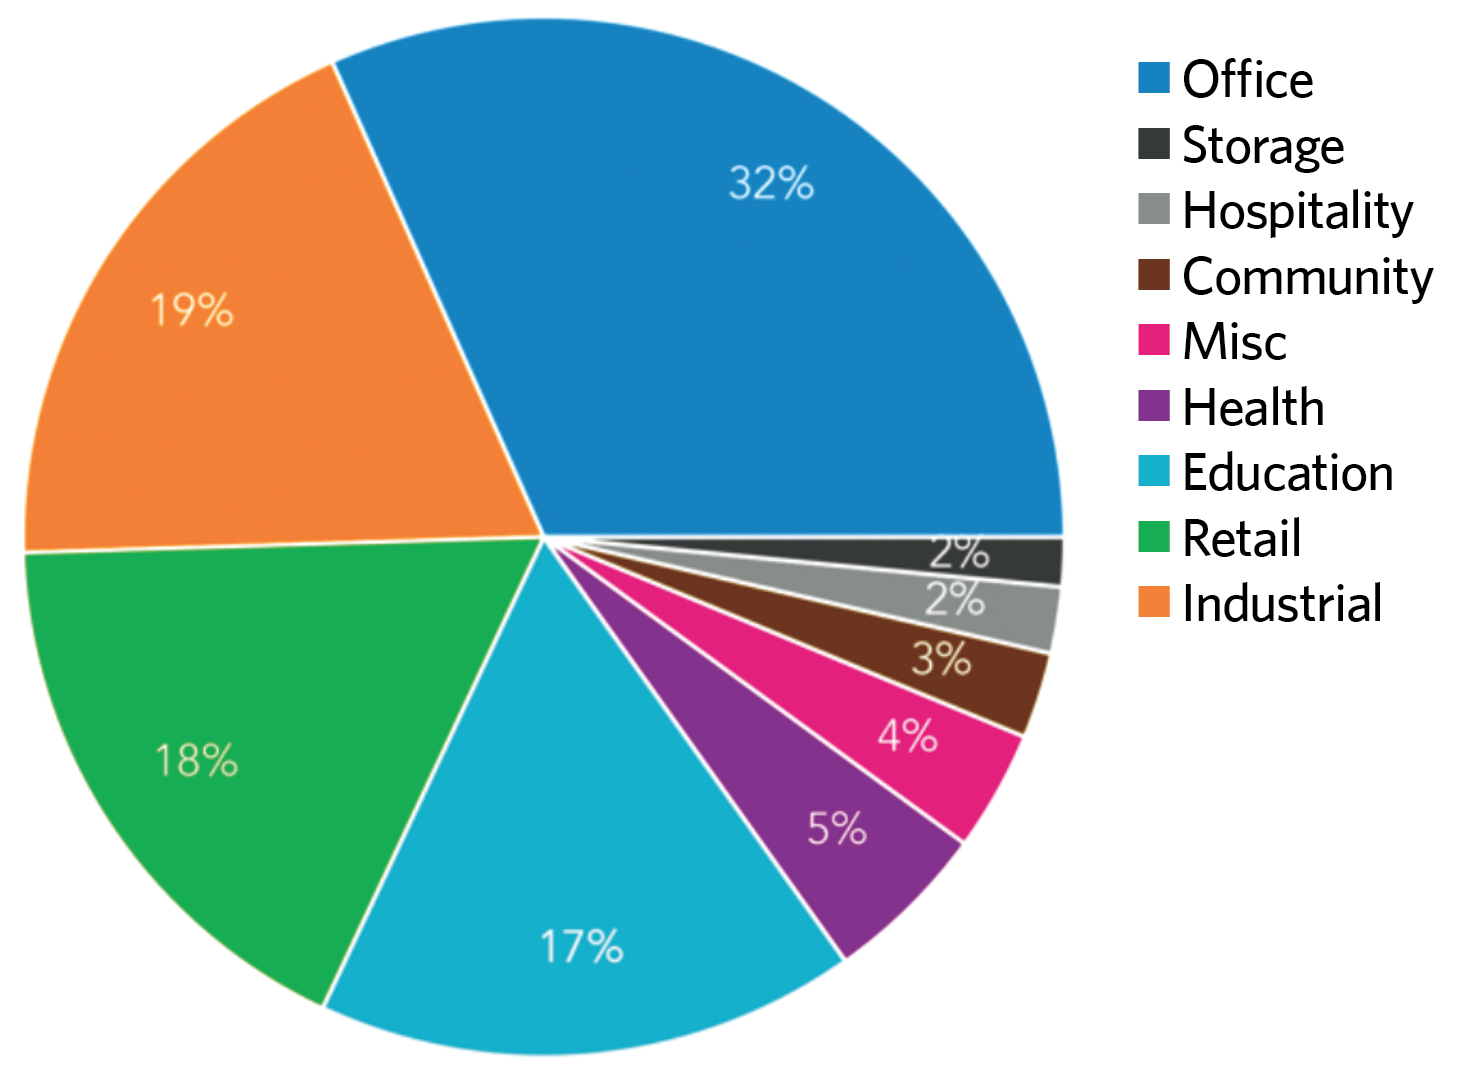
Figure 3: A breakdown of non-domestic floor area in London shows offices, retail, and industrial buildings as the top three areas
Using this new dataset, we built a predictive model for estimating energy consumption in individual dwellings. The following inputs have been identified as being the most commonly accessible parameters, and statistically correlate with energy consumption for homes. Using these inputs, our model (multivariate regression) outputs the annual energy consumption (kWh per year) estimated for the property. The inputs were: floor area; number of rooms; property type and form; building age; and deprivation index.*
When we applied our model to the whole EPC stock scaled to London, the total consumption for gas and electricity came close to the reported BEIS sub-national consumption statistics (Figure 2).
Non-domestic buildings analysis
Compared with the domestic sector, the analysis on non-domestic buildings was much more complex. There are two main reasons for this. First, the naming conventions of commercial buildings and company names in addresses makes them difficult to match between datasets, and second, the building use (for example retail, restaurants, schools and so on) are not standardised between datasets. For example, bars, restaurants and pubs may be grouped as one category in one dataset, but another dataset may have restaurants and cafes as one category, and bars and pubs as another category. Within this, there is also the added complexity of mixed-use buildings. Figure 3 shows the building categories with the biggest floor areas in London.
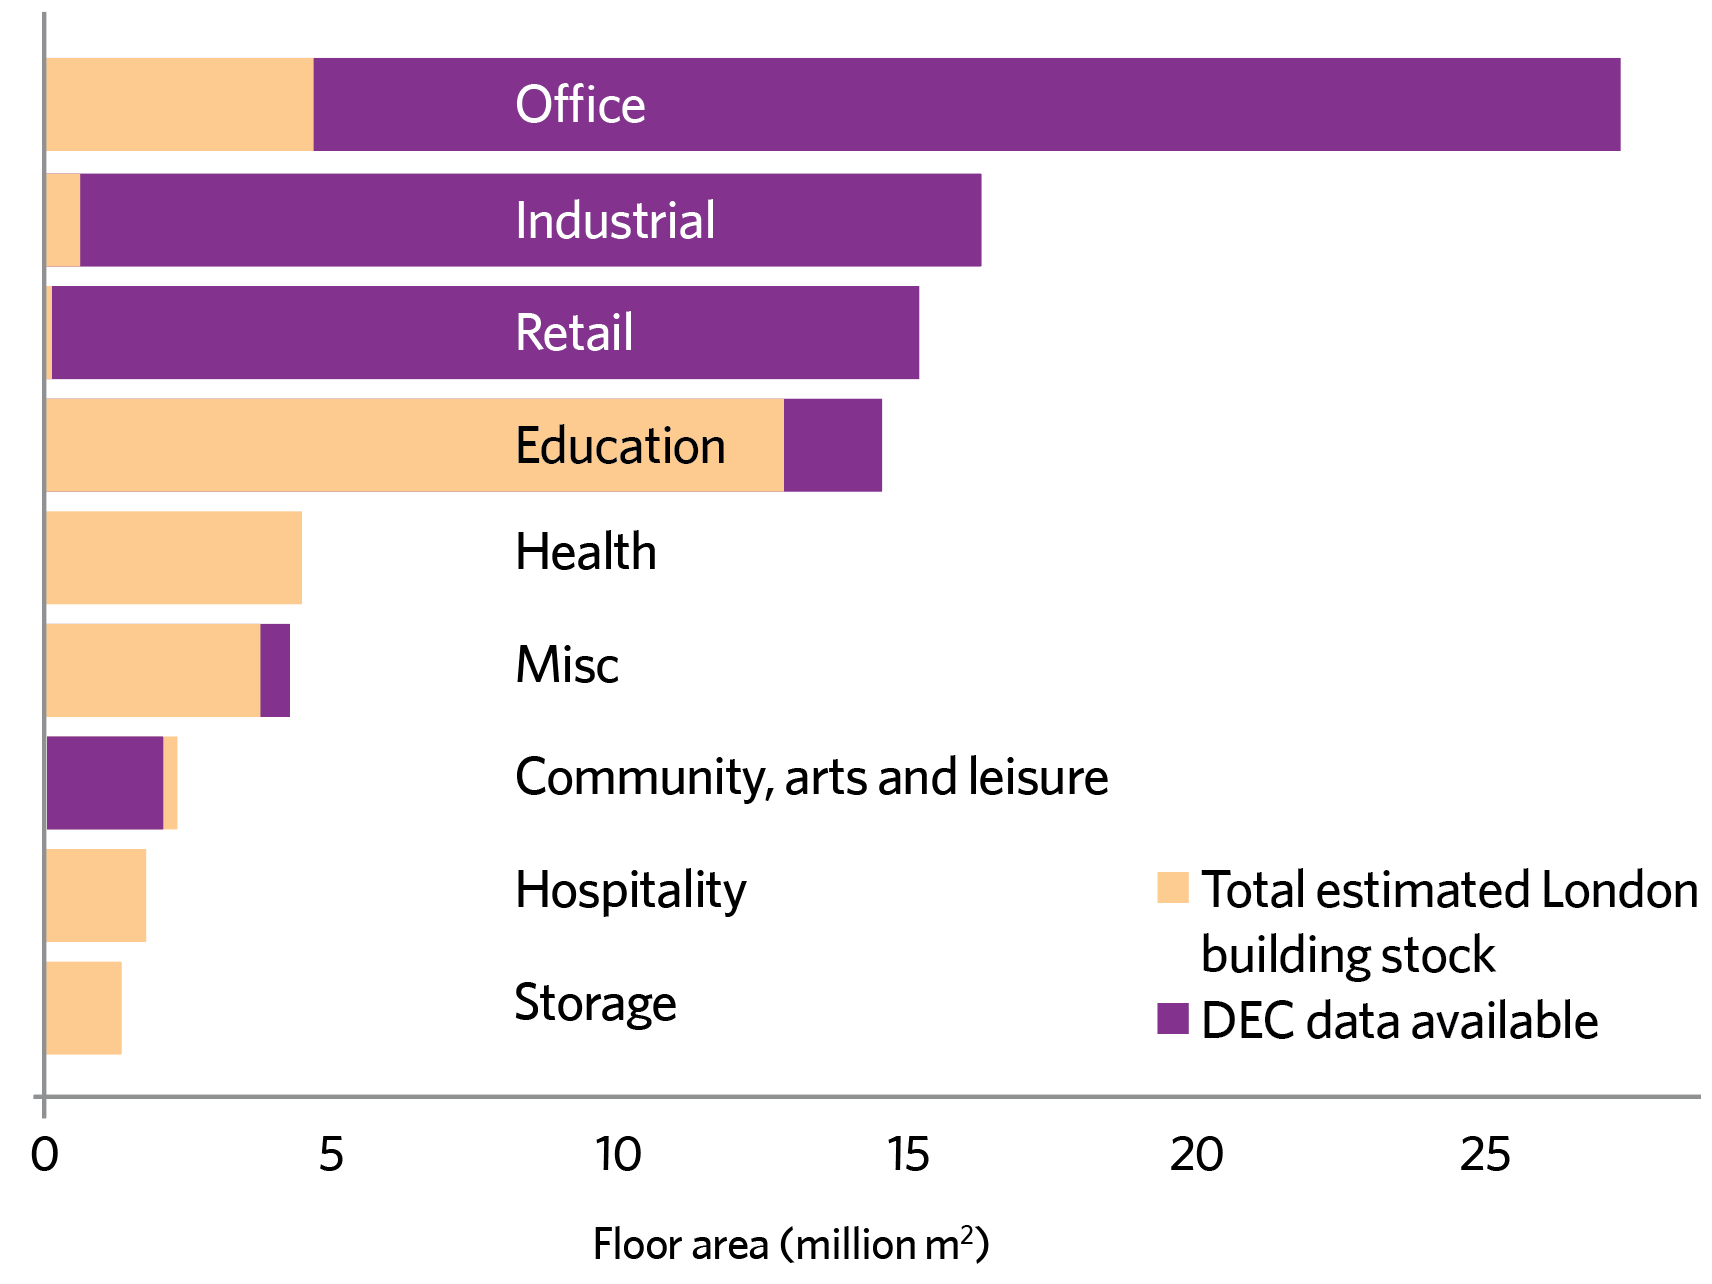
Figure 4: Median energy intensities from DECs of each building category
DECs are the only publicly available source of real energy data we have for non-domestic buildings, but it is not representative of London stock. Since DECs are required only for public buildings, they are effectively under-sampled in certain building categories.
There is limited data about non-domestic buildings to be able to understand operational energy. To get a better picture of the non-domestic building energy consumptions, we extracted the median energy intensities from DECs of each building category (Figure 4). This uses a similar approach to the recently released CIBSE benchmarking tool.
We then estimated the total non-domestic building energy consumption by multiplying the total floor area of the different building types with their median energy intensity (Figure 5).
Our estimates showed a significantly lower consumption when compared with the BEIS sub-national, non-domestic consumption statistics (Figure 6). We are fairly confident of our floor area estimates, and as far as energy benchmarks are concerned, those extracted from DECs are actually higher when compared with other building benchmarks (for example BEIS medians), both for electricity and non-electricity use. The question then turned to interrogating our ‘ground truth’ – the BEIS sub-national statistics.
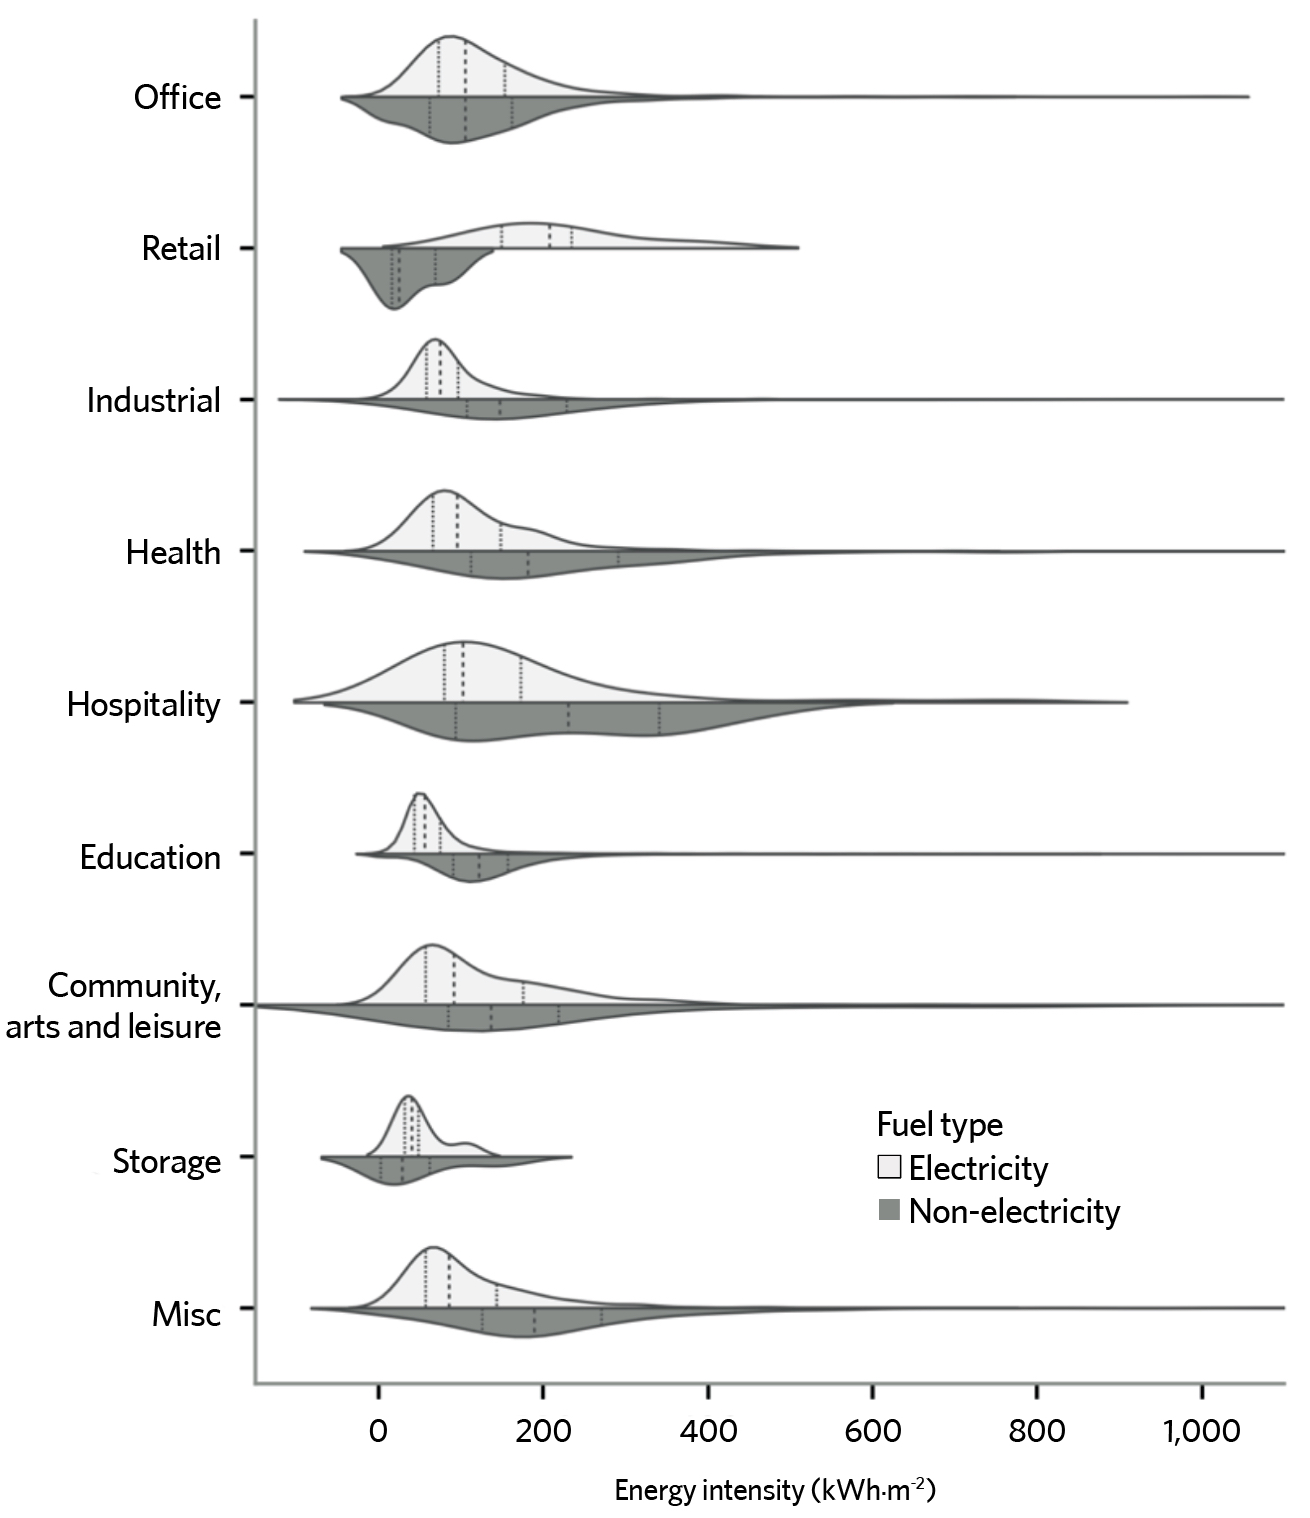
Figure 5: The energy use intensity distribution and medians extracted from DECs for each non-domestic building category
The magnitude in discrepancy between our estimate and the BEIS statistics is simply huge, and the exact proportion of the reported BEIS statistics that is made up from operational energy from non-domestic buildings is unknown.
BEIS uses a combination of threshold consumption and its own algorithms to differentiate between energy consumption from domestic and non-domestic meters. If a meter reading shows an annual gas consumption of 73,200kWh or higher, BEIS make the assumption that this meter is attributed to a non-domestic building. Any readings at a meter lower than 73,200kWh are assumed to be a domestic building.
The story is different with regards to electricity meters, where there are meter-profile classes that enable the BEIS team to more accurately differentiate between domestic and non-domestic consumers. But how much of this consumption is from operational energy in buildings and how much is from industry processes or data centres is still unknown.
When doing strategic planning work to help local boroughs develop zero carbon pathways, we are using the BEIS non-domestic consumption statistics as our gold standard reference. Evidently, a reduction in the BEIS statistics must be taken into account when carrying out analysis in buildings’ energy use though, but by how much?
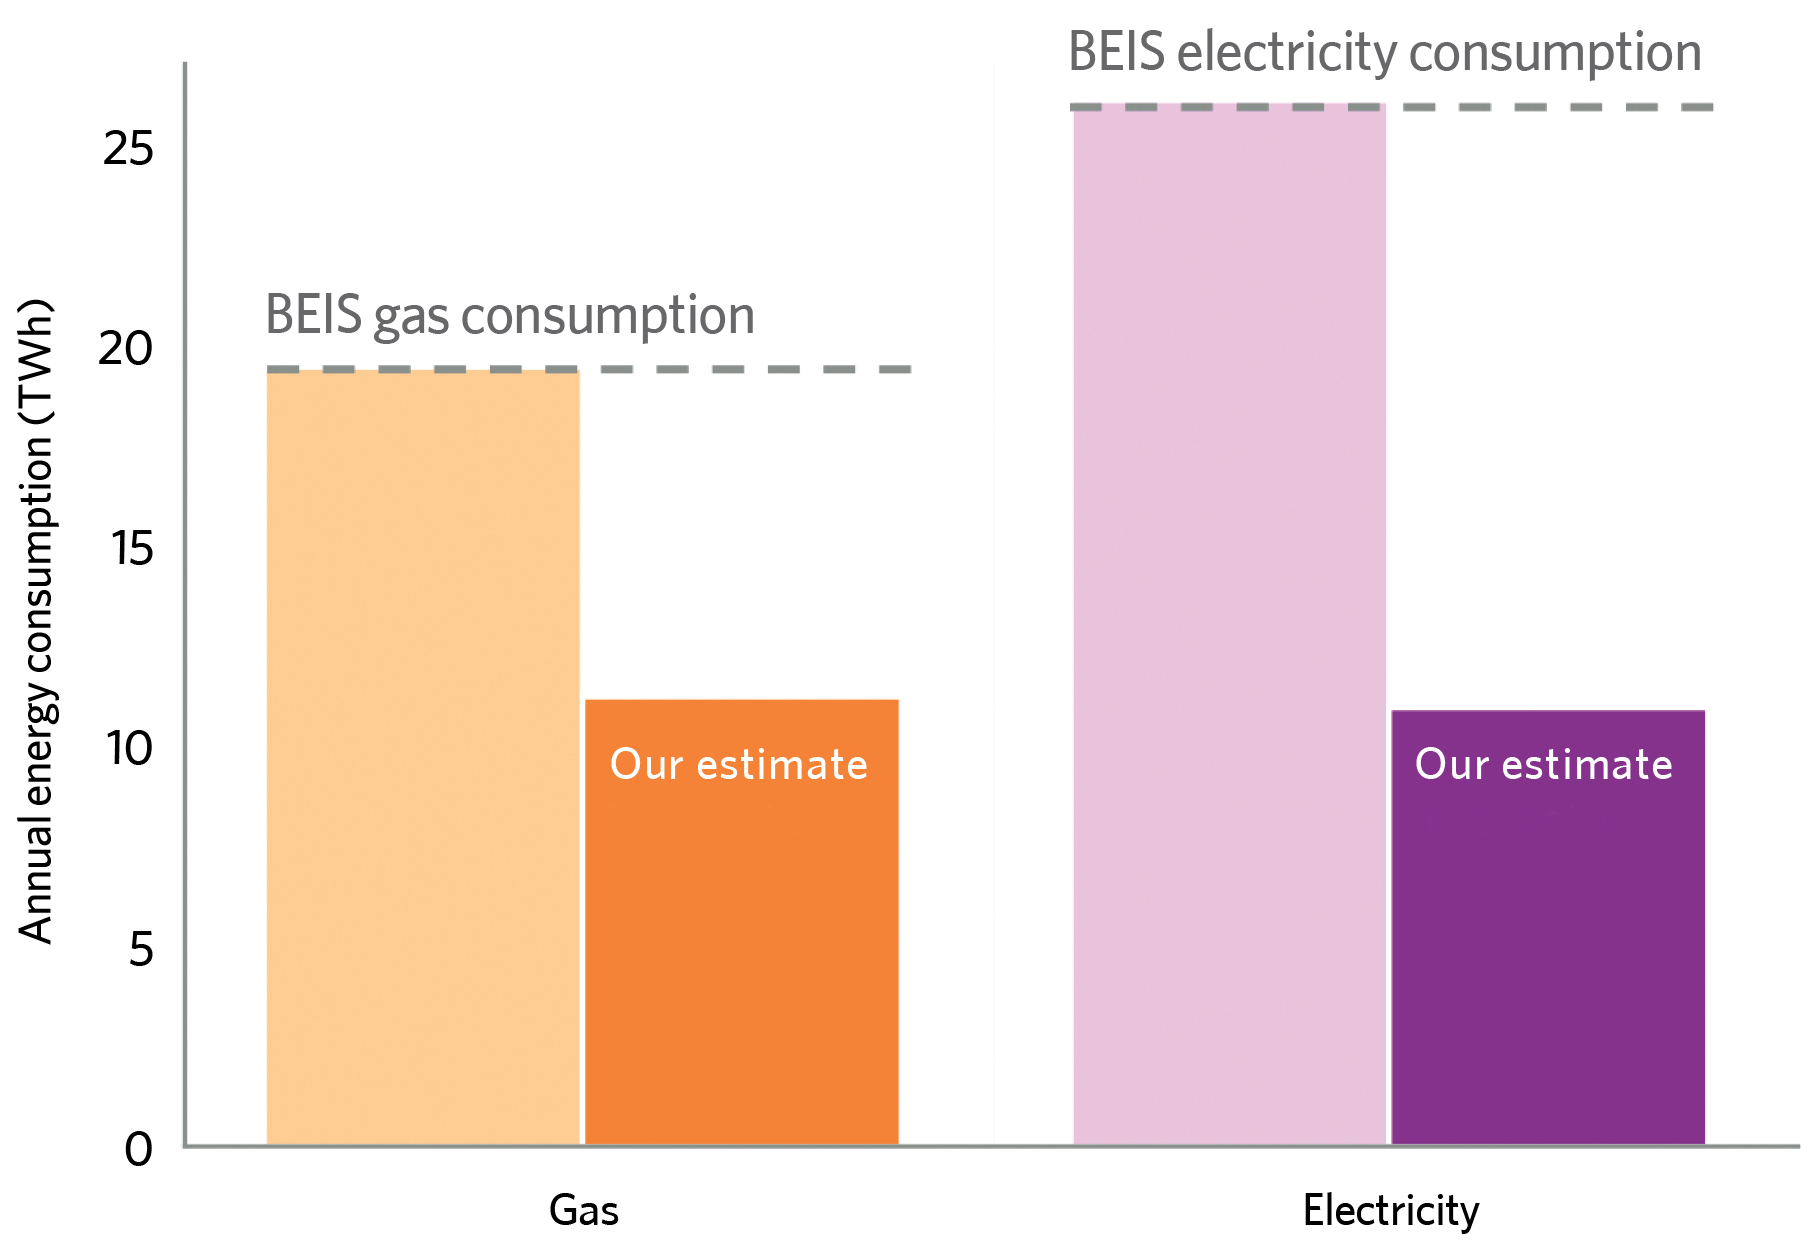
Figure 6: The reported BEIS non-domestic consumption statistics are significantly higher than our estimates
One thing is for certain – non-domestic energy use needs to be much lower to meet climate targets. The city of Toronto’s Zero Emissions Buildings Framework has set energy performance targets for a range of building archetypes (for example, office, retail, mixed use, high rise and so on) in its efforts to reduce buildings emissions. When we compare the median energy uses extracted from DECs to Toronto’s phased targets, it highlights the massive amounts of work we need to do in improving energy performance in our non-domestic buildings (Figure 7).
Having tried to estimate energy consumption in London buildings, we are in awe at the work that has come before, as well as of the complexity of the problem. Perhaps more disappointing is that we had to repeat a lot of work rather than building on already existing knowledge and data. We need much more collaboration between the public and private sectors, academia and NGOs if we are to help solve the climate crisis.
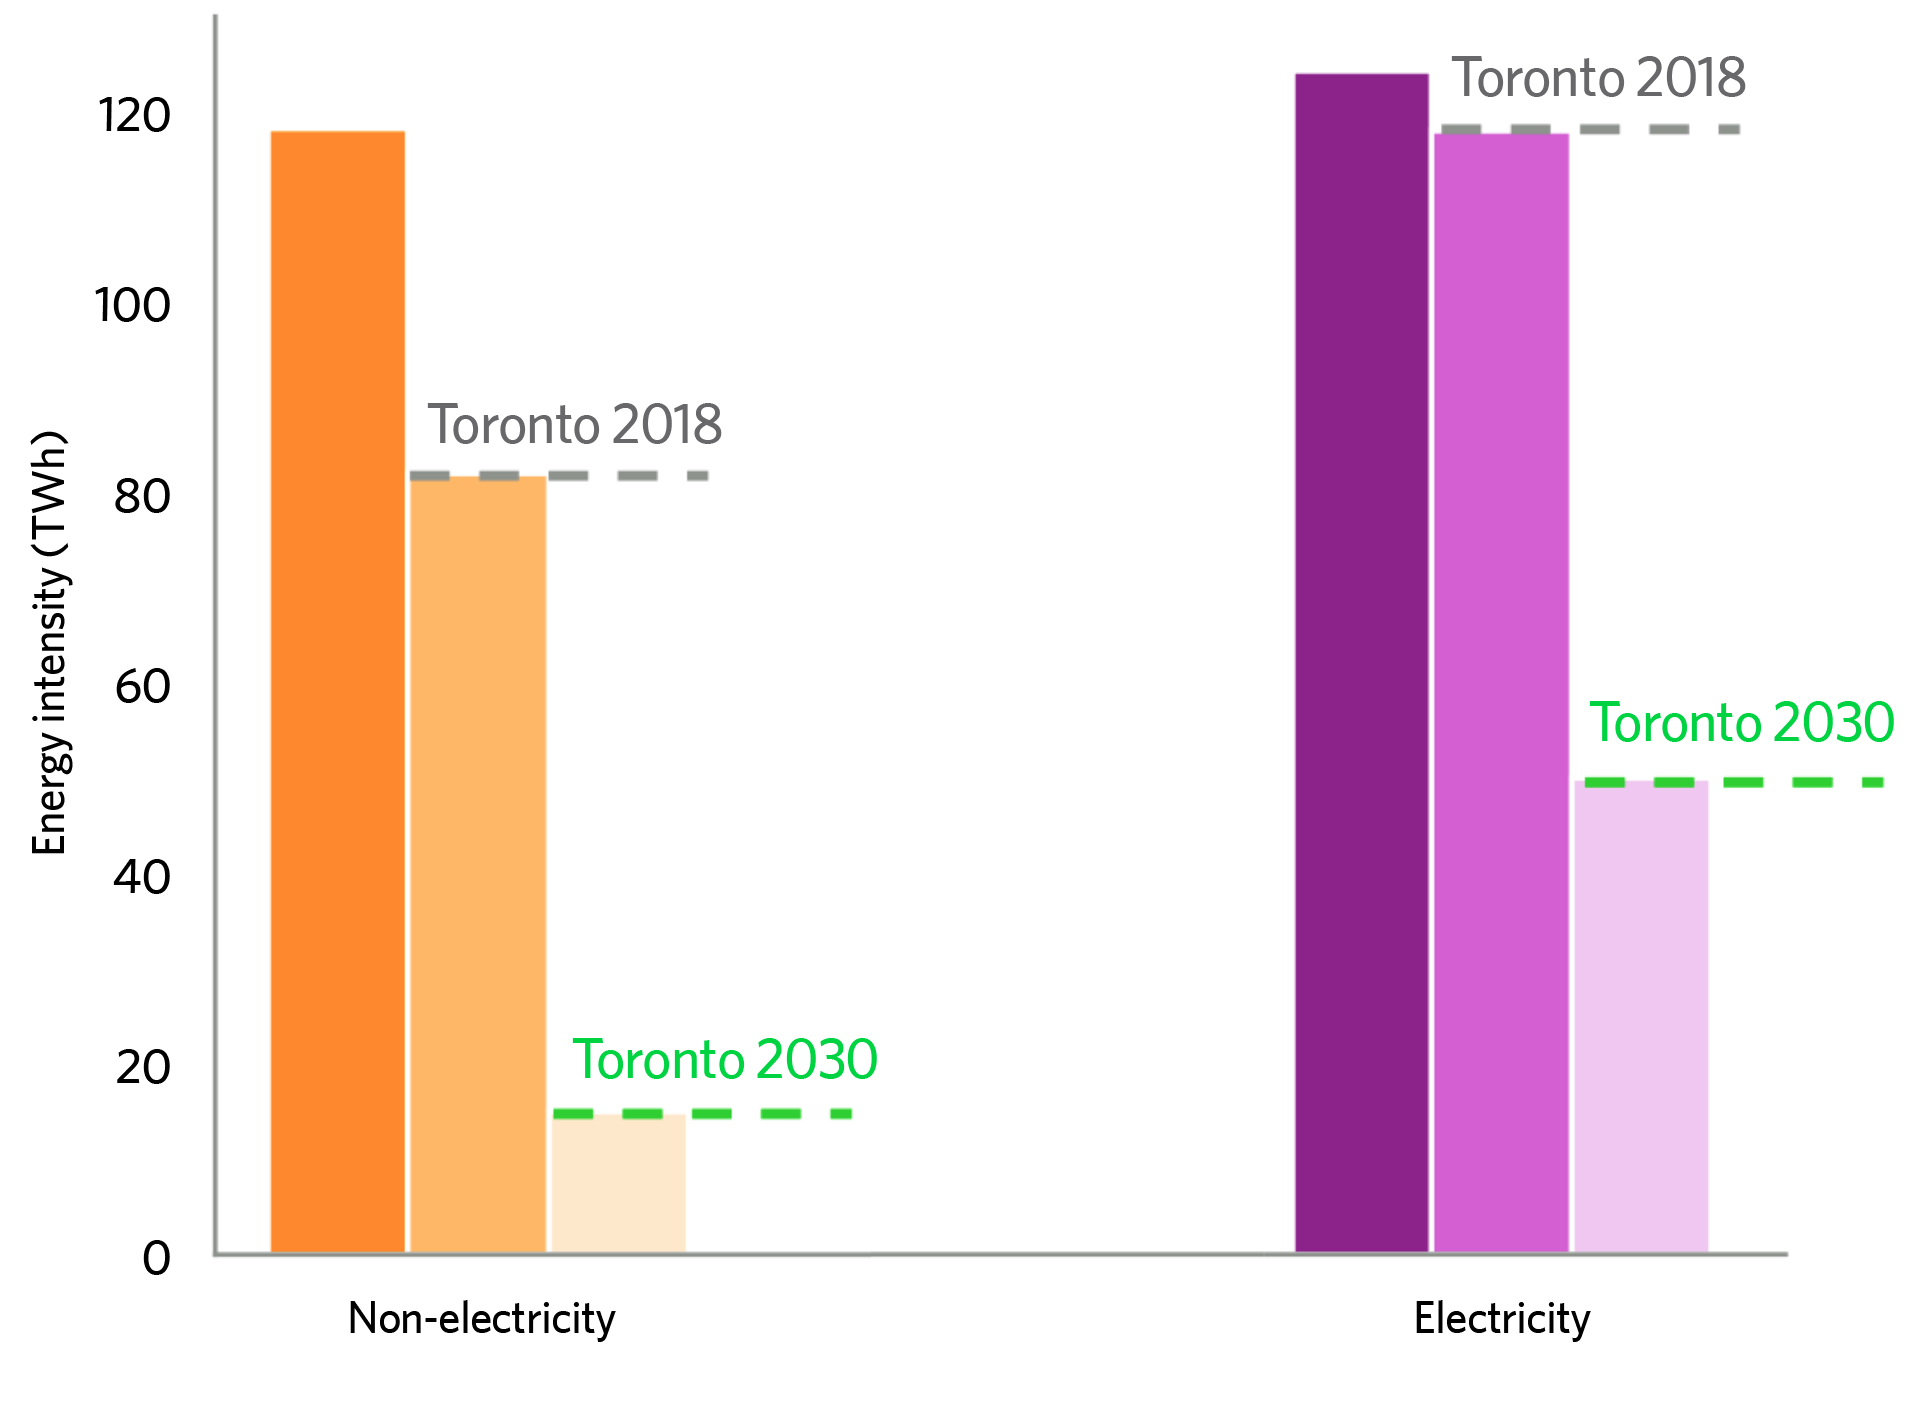
Figure 7: Comparison of median energy intensities between DECs and Toronto targets for 2018 and 2030 for offices shows huge reductions must be made to improve the energy performance
It is time for us in the building industry to embrace a feedback loop approach, meaning open data, and openness to admit what was done badly so we can collectively improve. How can we do better if we don’t acknowledge what our mistakes were? Now more than ever, climate change – correction, climate emergency – requires us to be open.
More information
- London Energy Transformation Initiative (Leti).
- London Energy Map project.
- Members of the project board: Dora Ma (Etude), Julie Godefroy (Julie Godefroy Sustainability), Clara Bagenal George (Elementa), Jonathan Taylor (London Borough of Tower Hamlets), Andy Stanton (Atkins) and John Palmer (Enhabit).
- *Deprivation is found to inversely correlate with energy consumption. The more deprived people are, the less they tend to use. We combined public data on the index of deprivation (MHCLG) in different areas to our dataset.
References:
- List of building energy databases, London Energy Map.