
The best way of getting a landlord, developer or property manager to look at staff or tenant wellbeing is to present them with a figure showing how much money they are wasting.
Tom Randall, director and development manager at online data analytics company Demand Logic, says the company has come up with a way of measuring loss of productivity.
The firm’s web-based platform – which extracts and analyses data from building management systems – now has an added function called ‘comfort tracker’. This records space temperature, identifying areas that are too hot or too cold, before calculating productivity loss.
Randall says: ‘People’s productivity can be affected by a whole lot of issues – such as getting out of bed on the wrong side in the morning – which complicates the matter, but it doesn’t detract from the fact that temperature will affect productivity.
‘We’re not saying this number is an absolute, but – used appropriately – it is an indication of the scale of the problem.’
Its method for calculating productivity losses is based on research by the Lawrence Berkeley National Laboratory, which conducted a ‘meta-study’ of nine studies into how temperature affects productivity. It established the upper and lower temperature thresholds – 21°C and 25°C – within which there is no assumed effect on productivity as a result of temperature.
According to these studies, there is a 2% decrease in productivity when temperatures exceed 25°C, and a 4.7% decrease when temperatures fall below 21°C.
After collecting the sensor data, the algorithm asks to what extent space temperature is outside the productive band of 21-25°C, and for how long. This is then multiplied by the productivity loss percentages, giving the average productivity impact per sensor per occupied period per day.
To work out the monetary annual productivity impact, the platform uses three assumptions, which can be adjusted according to an individual project. In the example below, these assumptions are that:
- There are three people to one sensor
- The average London annual salary is £41,000
- The average combined tax and office overhead is 50%
Multiplying these three assumptions produces the assumed annual staff spend, and this figure is then multiplied by the productivity impact.
Randall says: ‘This gives a reasonable starting assumption that can be adjusted according to more specific data from the client.’
He adds that a single financial figure attracts the attention of landlords or commercial property owners. ‘Asset managers do not want to get bogged down with tables, looking at kilowatt-hours – they want fast, meaningful order of magnitude data. But – as we tell all our clients – this figure must be approached with caution. It is simply a useful indication of issues worth addressing. Comfort tracking provides evidence that can become part of developers’ marketing material and key performance indicators, while paving the way to more targeted condition-based maintenance.’
Future trends
Demand Logic’s platform is currently employed at 60 sites, covering 100 buildings.
One of these is the Financial Times HQ, at 1 Southwark Bridge, London, which has reported that comfort complaints have halved since installation of the platform.
The data analytics company now plans to develop functions to indicate performance against Well Building Standard comfort criteria, including air quality and humidity. But Demand Logic is yet to look at research into the effect on productivity when recommended CO2 or relative humidity (RH) levels are exceeded. ‘But at the very least, we can plot how sensors are performing against the threshold,’ says Randall.
He says further insight can be gained from cross-referencing space temperature data with absence rates, building user survey (BUS) results, and hot and cold complaints. ‘Ultimately, productivity goes hand in hand with comfort. And with the added pressure of tenant satisfaction, retention and landlord reputation, this issue is only going to get bigger.’
Example
Demand Logic applied the ‘comfort tracker’ to a fully occupied, nine-storey, 9,000m², Grade A, 2004 office, in which chillers and boilers serve fan coil units, with four air handling units.
The model assumes that, for each degree above 25°C, productivity decreases by 2%, and for each degree below 21°C, it decreases by 4.7%. By analysing average half-hourly temperatures for each zone (discounting unoccupied times), and using the above model, the calculated total effect on productivity of being outside the thermally comfortable zone is 0.24%. Assuming there are 999 staff members, that the average salary is £41,000, and the average combined tax and office overhead is 50% (factor of 1.5), the approximate annual staff spend is: 999 x £41,000 x 1.5 = £61,438,500
So the estimated total annual loss because of temperature-related discomfort is: 0.0024 x £61,438,500 = £146,000
Thermal profile over time
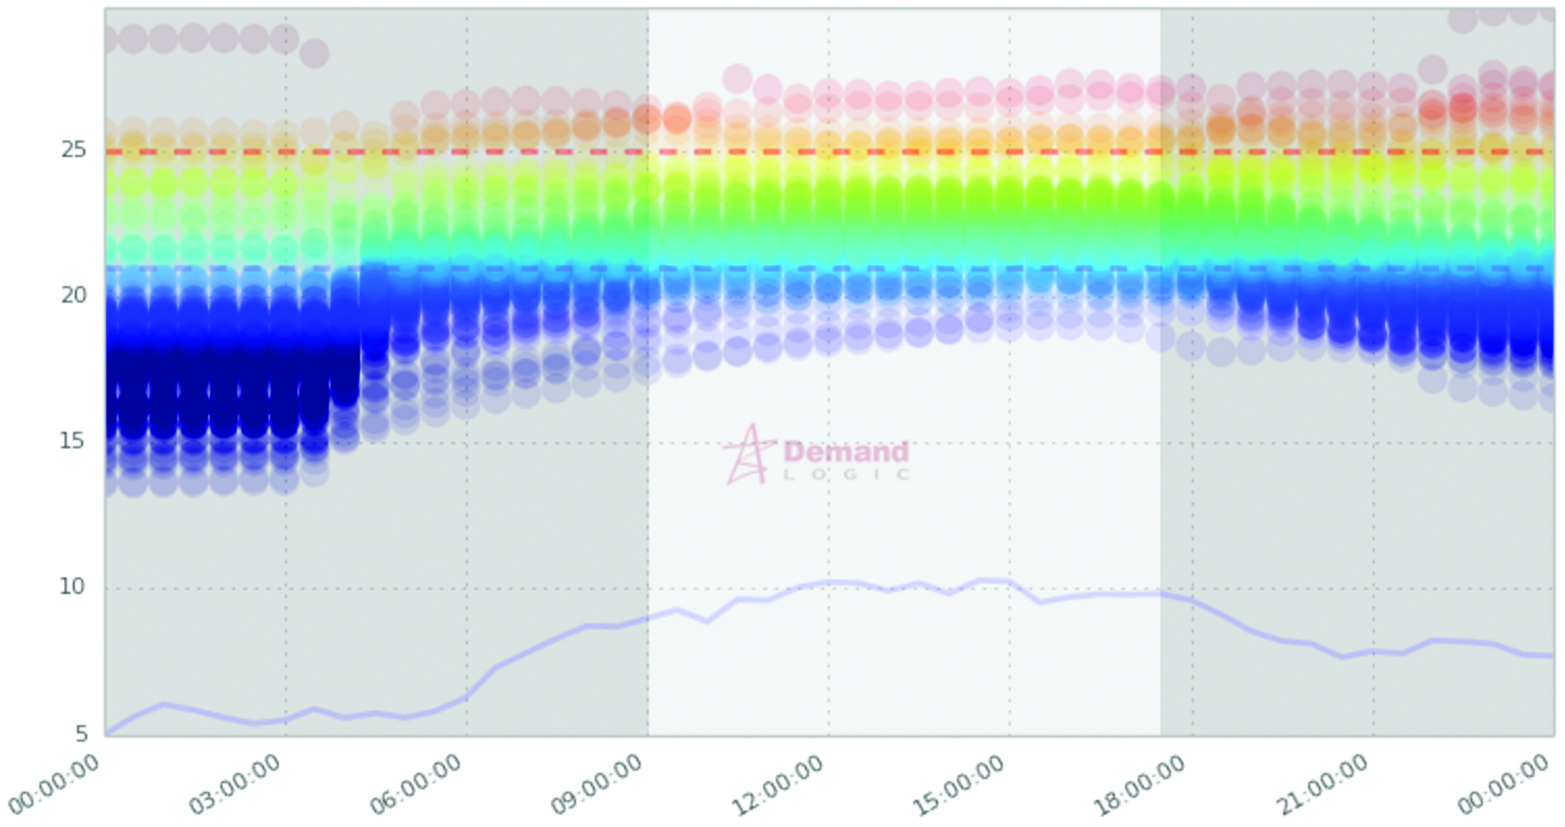
The dark red and blue circles above or below the dotted lines indicate uncomfortable temperature
How many spaces were uncomfortable throughout the day?
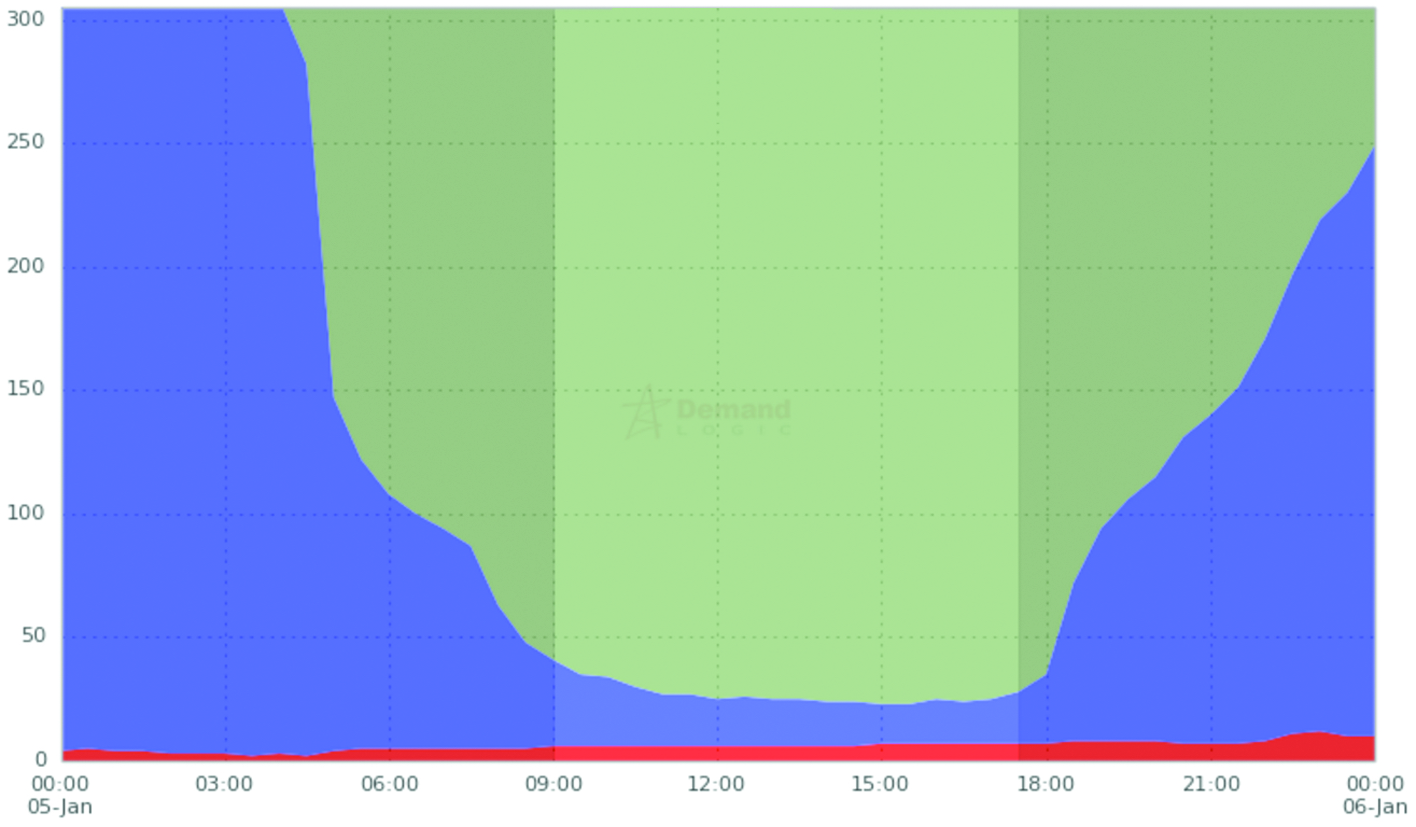
The red area shows how many spaces were too hot, and the purple shows how many were too cold