ndoor air quality is a hot topic. After years of focusing on building energy demand, evidence now shows we are harming occupants of buildings by failing to control pollutants and emissions. There are so many pollutants, however, it is difficult to know which are the most dangerous or the most prevalent, and which should be targeted first.
Current standards specify minimum ventilation rates that are set for odour control and are assumed to minimise contaminant exposures – and, so, protect occupant health. Accordingly, there is a need for performance-based, health-centred indoor air quality (IAQ) metrics supported by our best knowledge of health effects. They must be measurable, achievable and have a positive impact on the physical health of occupants.

In Nottingham, we have been measuring particulate matter with a diameter of ≤2.5µm (PM2.5) for years. The Air Infiltration and Ventilation Centre (AIVC) estimates that this is the most dangerous pollutant found in homes because they are prevalent and small enough to bypass biological defences, which links them to chronic respiratory and cardiovascular diseases and cancer. So it seems pragmatic to consider this pollutant first.
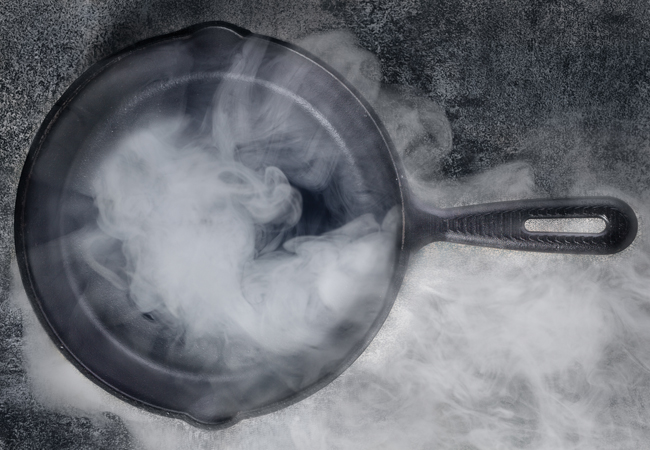
We’ve been measuring PM2.5 concentrations for several purposes in two locations. The first is a test chamber, where we have investigated known emitters, such as electronic cigarettes, aerosol deodorants, and cooking. We use the measurements to see how their emission rates change over time, perhaps as a function of some input – for example, adding a new ingredient to a frying pan. We used them to estimate the total mass of particles emitted, and to calculate an average emission rate that can be used to set minimum ventilation rates in buildings. The second location is the kitchen of houses, where sensors were placed to see what happens when occupants cook, and to see if extractor fans are used and if they work.
Getting the measure on particulates
We use optical devices that sample every second and use the light-scattering method to detect the amount of laser light scattered by particles at 90 degrees. The degree of scattering varies according to particle density, size distribution, shape and refractive index, so particles of equal diameter and different origins have divergent degrees of scattering.

The University of Nottingham’s study investigated known emitters, such as electronic cigarettes, aerosol deodorants and cooking
Optimal performance occurs when both the airflow rate through the device and the light scattering are calibrated. Our devices are factory calibrated using Arizona test dust defined by ISO 12103-1:2016 Road vehicles– Test contaminants for filter evaluation – Part 1: Arizona test dust. Measurements of PM2.5 require a calibration factor – a simple multiplier that scales a measurement to give a meaningful value.
A second device, known as a gravimetric sampler, is needed to obtain a calibration factor. It uses a pump to draw air though a PM2.5 impactor, which then moves the air through a convoluted path so the inertial and aerodynamic drag forces cause larger particles to collide with, and stick to, a greased plate – and a filter at a known airflow rate for a defined period of time. Filters are weighed before and after a sampling period under controlled environmental conditions described by EN 12341:2014 Ambient air: Standard gravimetric measurement method for the determination of the PM10 or PM2.5 mass concentration of suspended particulate matter. This ensures humidity does not affect the filter mass, which is important when the changes can be so small that their measurement requires a five-decimal-place balance located in a case to stop local air movement vibrating it. The mean average particle concentration is determined from the sampling time, the increase in filter mass and the airflow rate. If the gravimetric and optical samplers are co-located and measured for the same period of time, their average concentrations can be compared.
At least three measurement periods are required for a calibration factor, which is determined from the linear regression through the origin of the mean concentrations measured by each device. Identical optical devices commonly have different calibration factors. We recently worked with the Netherlands Organisation for Applied Scientific Research, cooking four different meals six times each in a tightly controlled test kitchen. We found that each meal had a significantly different calibration factor, so it is not possible to use a single factor to represent all meals without introducing uncertainty. In addition, some optical devices are calibrated using polystyrene latex spheres, which have uniform size and light-refracting properties standardised by the US National Institute of Standards and Technology. A calibration factor obtained for a device calibrated using Arizona dust cannot be used by one calibrated using polystyrene latex spheres.
The need to measure PM2.5 in buildings is undeniable, but measuring them is challenging because the metric does not describe a physical or chemical component of the air, but is defined by the measurement method itself
Ensuring confidence in measurement
The need to measure PM2.5 in buildings is undeniable, but measuring them is challenging because the metric does not describe a physical or chemical component of the air, but is defined by the measurement method itself. These difficulties are reflected in the measurement uncertainty of ±25% for PM2.5 required by the UK’s Air Quality Directive for ambient concentrations. It is set at ±15% for most other pollutants.
Measuring PM2.5 without diagnostic guidelines will lead to the manipulation of measurement conditions and data to meet a benchmark. For example, an hourly spot measurement could lead to an elevated reading, perhaps attributable to poor mixing or the measurer’s proximity to a source. To counteract this, many measurements could be made and the lowest taken; the data could be time averaged; or measurements could be made away from known sources, such as in the corners of rooms. Without requirements for measurement devices and their calibration, an optical device with a course resolution could be used to give leeway, and expert judgement could be used to apply a calibration factor of <<1 without penalty.

So where should we look for guidance? PM2.5 concentrations in ambient air have been systematically monitored in the UK since 1987. For a gravimetric measurement to be used to demonstrate compliance against an air quality standard or norm, the measurement procedure must follow the Reference Method in EN 12341. It controls the design of: the gravimetric sampler (pipe work, filter holder, flow control system, leak tightness); the sampling period; the storage conditions of the filters; and the weighing facilities (balances and room) and procedures. In the US, these methods are enforced by a Federal Regulation.
Gravimetric measurements of PM2.5 concentrations are the most accurate because they directly record the acquired mass of particles on a filter over a known period of time, but they do not have the granularity to be a good diagnostic tool. Real-time optical devices can be used to measure ambient air, but they must demonstrate equivalence to the reference method, defined by EN 16450.
To ensure indoor measurements are accurate, precise and repeatable, we need standards that clearly define sensor types, calibration methods, resolution, sampling frequency, desired time averaging periods and measurement locations. They must also require adherence to the reference method and the demonstration of equivalence. Only then can we think about using indoor measurements for regulatory purposes – that is if we can agree on suitable IAQ performance metrics in the first place.
A fully referenced version of this article can be found here.
Dr Benjamin Jones is assistant professor in the department of architecture and built environment at the University of Nottingham