
The Covid-19 pandemic exposed numerous issues with ventilation in NHS buildings, with multiple hospitals experiencing uncontrollable transmission and outbreaks. A key problem is that many of our NHS hospital buildings were built to outdated health building standards and are therefore poorly ventilated. There is a pressing need for innovative technologies that can be implemented simply in these areas.
Air purification or cleaning devices have been discussed as a solution, as they provide a localised and decentralised means of ventilation without the need for large plant and distribution systems.
Leeds Beckett University’s Lewis Turner investigated the performance of air purification systems to reduce infection. His paper, Efficacy of air purification to control infection in NHS hospitals, looked to benchmark air purifiers against currently used mechanical and natural ventilation techniques within an NHS hospital ward scenario (as shown in Figure 1). Last month, the paper was runner-up in REHVA’s student competition.
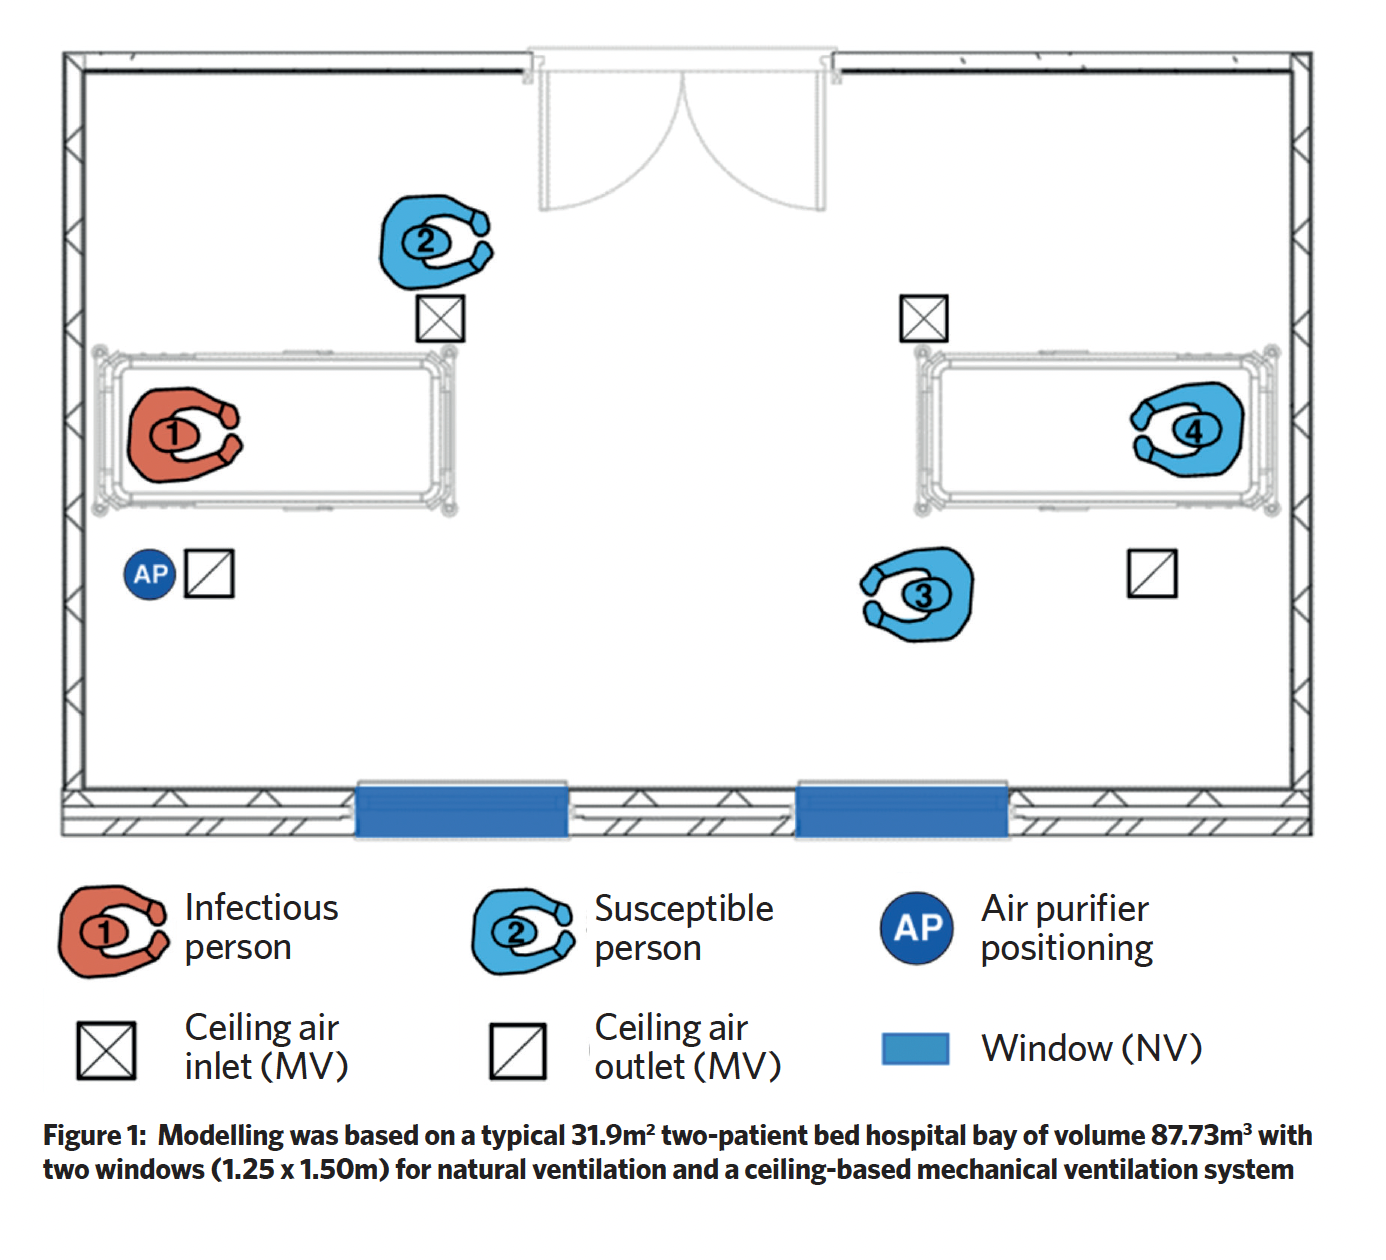
In Turner’s scenario, there are four males on the ward: person one is infected with a respiratory virus and has symptomatic coughing, while the others are not infected but are susceptible to infection.
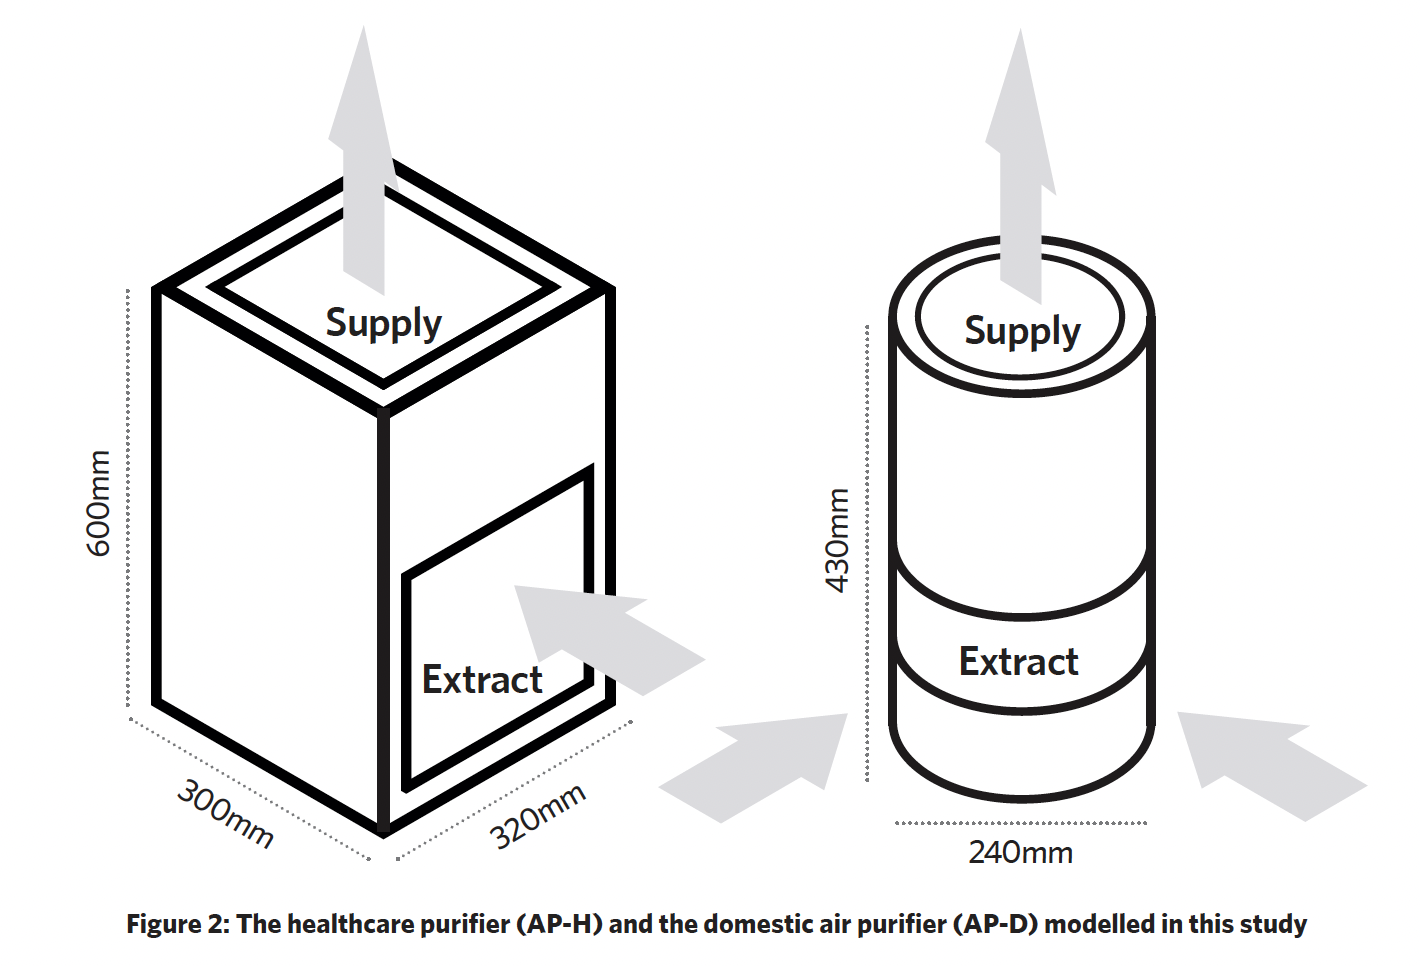
Two air purifiers (AP) were studied, one representing a ‘healthcare grade’ system and the other a ‘domestic’ system (as shown in Figure 2). The healthcare air purifier (AP-H) had a ‘side in, top out’ flowrate of 520 m3.h-1 and a maximum aerosol efficiency of 99.728%. The domestic air purifier (AP-D) had a maximum flowrate of 190 m3.h-1 and maximum aerosol efficiency of 99.82%. In the scenario, the air purifiers were located on the floor, to the right of person one.
Lewis modelled the risk of infection and developed a computational fluid dynamics (CFD) model to investigate the pathogen airflow characteristics, benchmarking the APs against the mechanical and natural ventilation systems. The mechanical ventilation ductwork system in Figure 2 provides balanced ventilation of six air changes per hour with a volume flowrate of 528 m3.h-1. The natural ventilation was provided through the openable windows and with average wind speeds and window opening, the study used an average fresh airflow rate of 185 m3.h-1.
The infection risk mathematical modelling calculated the probability of susceptible people catching an infection when in the same ventilated space as infectious people. The CFD study simulated cough particulates travelling through air and how they interacted with the ventilation systems. Person 1 was simulated sitting up in bed, coughing 3.13 e-8kg of Covid-19-infected aerosol into the zone within a period of 0.5s at 90º to their face, with a velocity of 10m.s-1 from a 4cm2 mouth positioned 590mm above the bed. Cough particulate had a randomised diameter of between 2.5mm and 200mm, consisting of liquid water. The natural ventilation was not simulated because of the chaotic nature of the airflow.
Around 85% of visits to emergency departments are less than four hours long, so the study focused on the number of subsequently infected patients under typical circumstances, across a four-hour period.
The infection risk mathematical modelling results, shown in Figure 3, indicate similarities in performance of AP-D and natural ventilation, with a performance differential of 10.7% in favour of AP-D. AP-D and natural ventilation have a comparable flowrate, but have different mixing factors of 2 and 2.5 respectively. The mixing factor has a significant impact on performance because it defines how well fresh air dilutes the pathogen. This impact is higher for natural ventilation because of unpredictable natural airflow currents, which cause ineffective mixing. For AP-D, the airflow (treated and supplied by AP-D) is directed into the zone at a constant level and can mix effectively with the internal air.
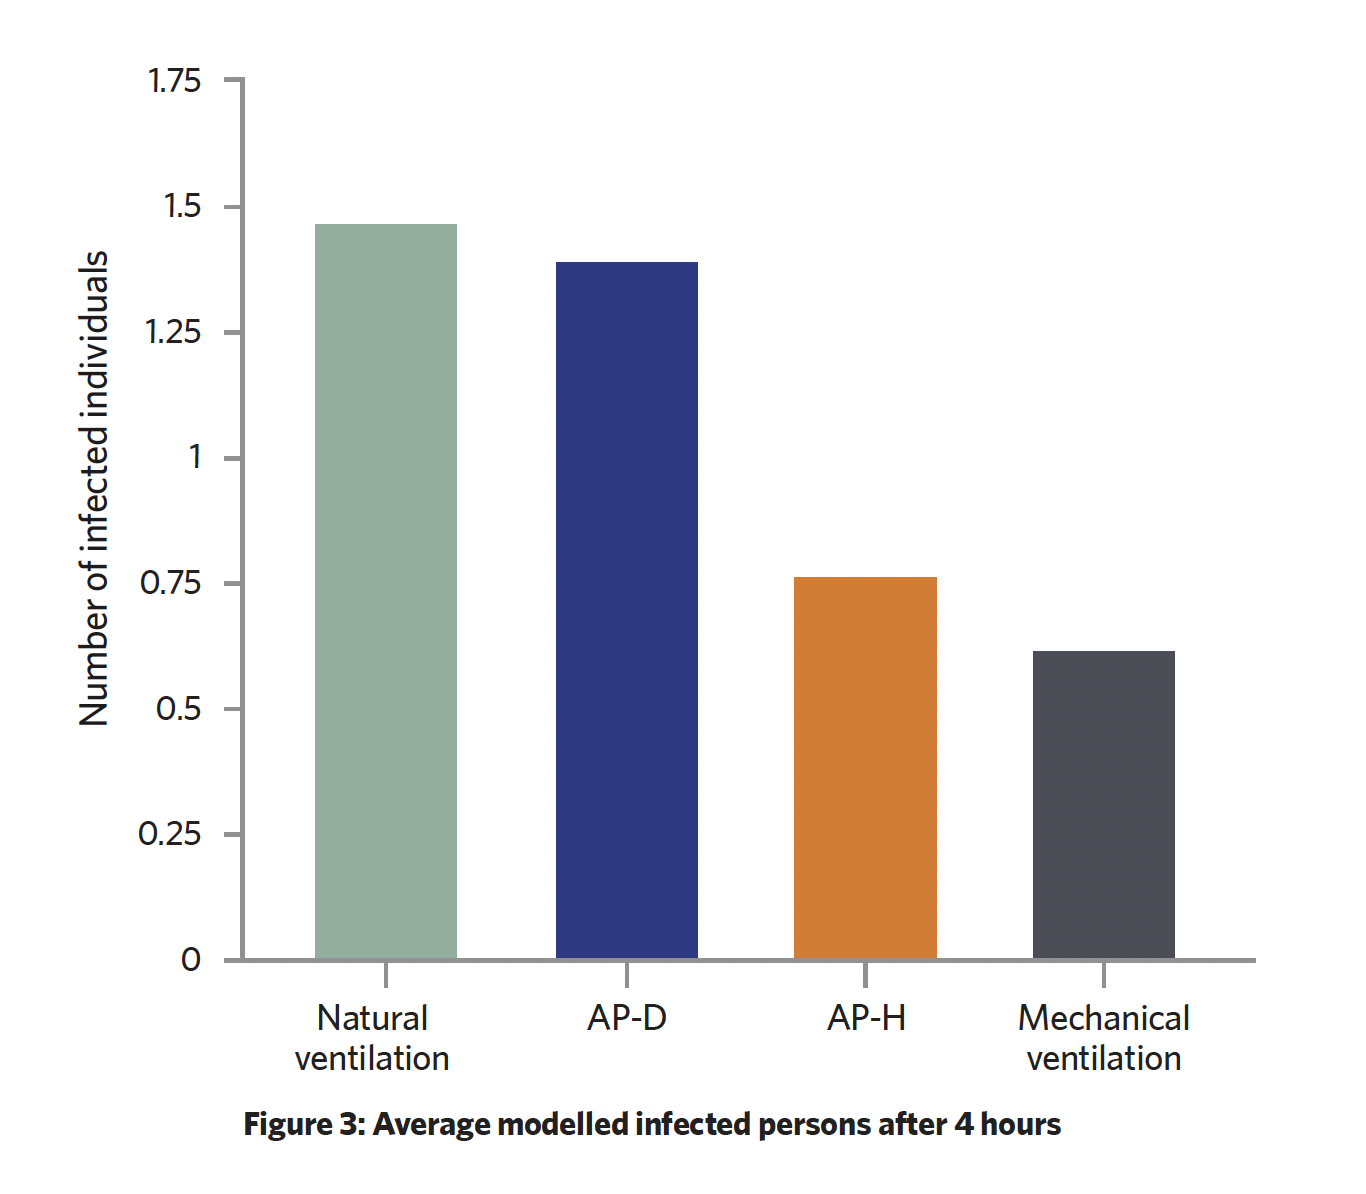
The study identified that the higher mixing factor for the APs results in a 29% higher infection probability, with the lack of fresh air supply contributing to the poor performance of the air purifiers to control infection. Both APs dilute pathogens with greater performance than natural ventilation.
The CFD study generated three sets of data, two of which are shown in Table 1. These indicate that mechanical ventilation has the highest performance. The APs do, however, present some efficacy for infection control as they reduce the particulate mass to 5% in less than 13 seconds (mechanical ventilation can reduce it to 5% in 4 seconds). All ventilation systems fail to remove a majority of the infectious particulate, which means much of the particulate is still present on walls and surfaces, and can sustain for multiple days, depending on the material.
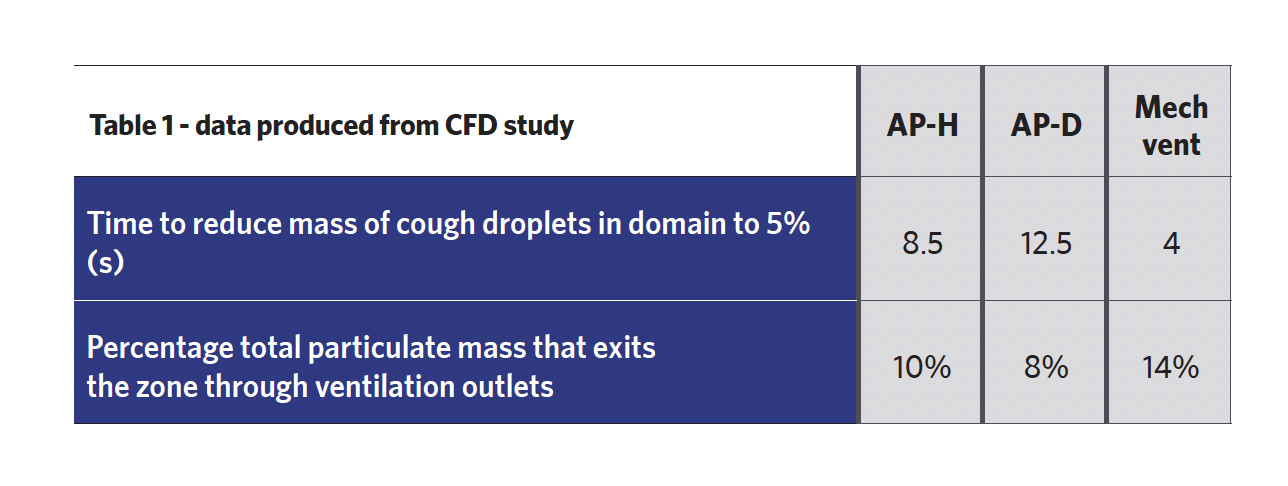
Figure 4 presents the third set of data from the CFD simulation – the maximum penetration distance of particles within the zone from person 1. The data has been compared with the distance of each susceptible person to identify if particles could potentially come into contact with them. It is assumed that 1.25e-9 kg of particulate mass represents an infectious load of Covid-19, so greater than 1.25e-9 kg indicates a higher infection risk and less than 1.25e-9 kg indicates a lower infection risk. Overall, mechanical ventilation has the highest performance, with only one susceptible person potentially inhaling an infectious load. There were three potential infectious-load inhalations for AP-H and two for AP-D.
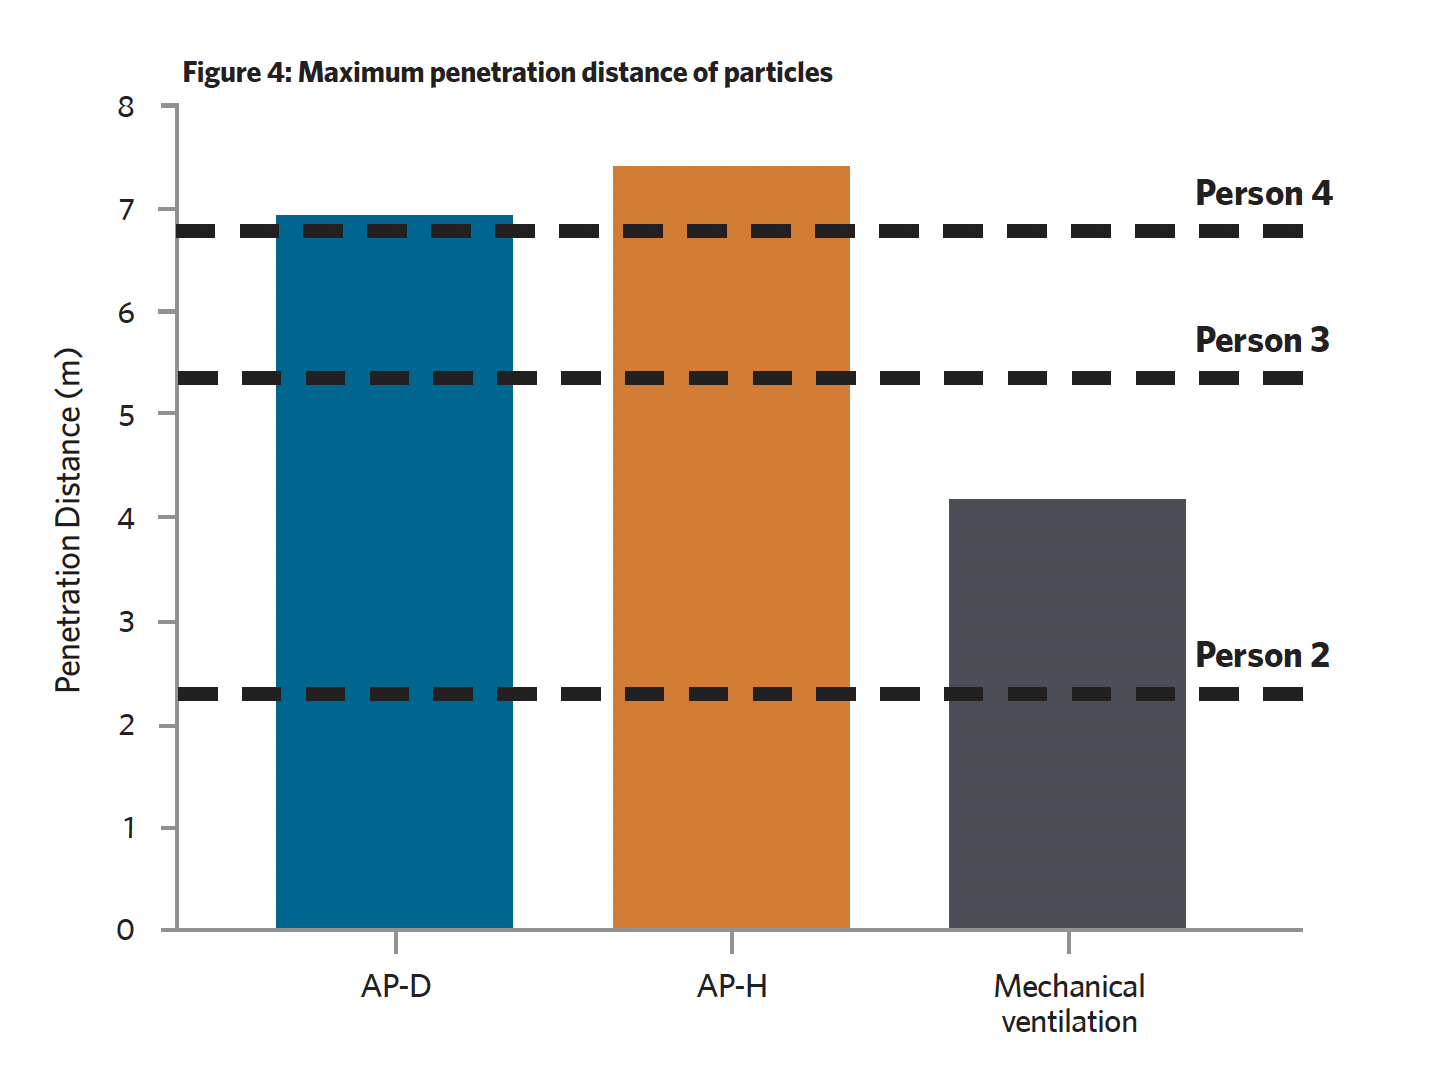
The results identified that all ventilation systems fail to effectively remove infectious particulate from the zone, with most of the particulate that remained found on the ward’s walls and surfaces. Particles become scattered and, consequently, miss the intake to the APs and contact the air purifier body and surrounding surfaces.
These findings indicate that the size of intake to each system impacts the total escaped mass – and as the air purifiers have a smaller particle extraction capture area, they cannot remove as much mass as the mechanical ventilation system.
The results identified that AP-H and AP-D fail to control the penetration of infectious particulate effectively, whereas the mechanical ventilation system can control particulate with much higher effectiveness.
This issue seems to be amplified by the low position of the air purification devices, as the supply from the APs is much closer to the injection point than the AP intake. As the particles move to be drawn in by the AP, they are likely to be impacted by the turbulent upward airflow from the AP. Additionally, the short-circuiting between AP intake and supply can reduce their efficacy, as further penetrated particles cannot be drawn into the APs. This does not occur in mechanical ventilation because of the effective air distribution throughout the zone.
AP-H is found to exceed the performance of AP-D throughout the infection probability modelling, and the CFD results seem to corroborate these results.
Lewis concludes that these air purifiers have a higher performance than natural ventilation and should be considered for hospitals where mechanical ventilation is not available. However, he notes that air purifiers cannot perform to the level of standard mechanical ventilation, so should not be used as an alternative.