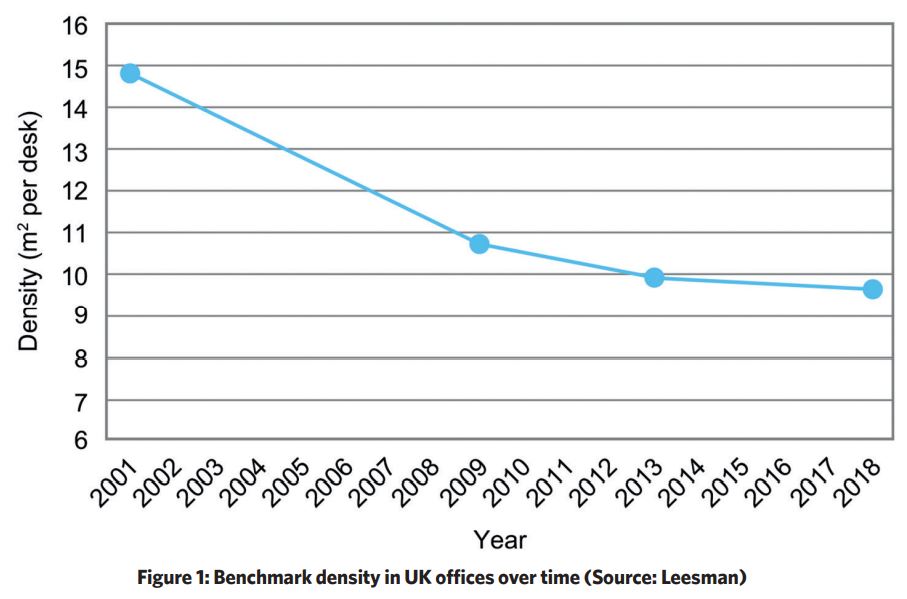
In 2001, average office density in the UK was approximately 14.8 m2 per desk on a typical floor. By 2018, the British Council for Offices (BCO) found the average density was 9.6m2 per desk.1 This gradual densification made UK offices among the most densely populated in the world.
This summer, the BCO published a position paper2 proposing new benchmarks for occupancy that reflect changes in office use in the aftermath of Covid-19. Now, new research has been released in the BCO’s Future of office densities report to support the revised BCO guide to Fit-Out recommendations.
However, recent definitive occupancy research showed that the average office has a 40-60% utilisation of its space, with mid-week peaks of only 33%. The impacts of the pandemic and concerns about climate change mean work patterns and occupancy levels have changed, and the BCO says new guidance is needed on how to redesign and operate offices for this new normal.
As a result, the position paper proposes that the high-density occupancy of 8m2 net internal area (NIA) per work setting is withdrawn and that the effective workplace density for core design elements of 12.5 m2 NIA per person is replaced with 16.7 m2 NIA per person.
The original effective density was based on 10m2 per workspace and 80% utilisation. The position paper now recommends that utilisation levels are reduced to 60%, which effectively means the BCO is proposing that density is now 16.7m2 NIA per person.
The new report looked at the impacts of over-densification (8m2 per person) on UK offices in terms of performance and wellbeing, occupant expectations post-pandemic, work patterns and setting, and the need to create offices that meet net zero carbon targets.
The researchers gathered evidence from quantitative and qualitative sources, then triangulated and interrogated the findings to arrive at the new recommendations.
There was an in-depth analysis of a longitudinal dataset of 13 offices, tenancies and floors spanning 21 years by Dr Roderic Bunn and an analysis of the Leesman Index database (which includes a subset of 74 buildings with measured density data).
The Leesman survey3 was designed to enable occupiers to understand how the spaces that employees use impact their ability to do their work, and the key drivers for employee experience. The survey helps identify the important activities associated with respondents’ roles, and how well the workplace supports those activities.
Leesman’s 2018 statistical analysis revealed a series of distinct patterns, which uncovered critical work activities and workplace features that determine workplace experience. These components are key drivers for employee experience.
Factors contributing to workplace satisfaction:
There are four worker activities and six workplace features that contribute most consistently to overall satisfaction.
Work activities:
- Individual work, desk based
- Learning from others
- Relaxing/taking a break
- Thinking/creative thinking.
Workspace features:
- Noise levels
- Accessibility of colleagues
- General décor
- Desk
- General tidiness
- Small meeting rooms.
The worst-performing office areas with density-related problems combined the following elements: high density permanent workstations, not enough toilets, limited personal space, few escape opportunities, open plan control zones unfit for reconfigurement, unbalanced temperature for gender difference, and high reverberation times. If uncontrolled, these factors adversely affected work activities.
Conversely, there can be adverse effects of an office of low density, for example, knowledge transfer between employees may be restricted.
Post-pandemic, there has been a significant increase in agile/hybrid working arrangements. Interviewees estimated pre-pandemic occupancy levels of 70% ± 10% and a likely future occupancy of 45% ± 10%. However, survey respondents estimated higher occupancy.
Pre-lockdown occupancy levels were recalled as 81% ± 16%, and a future planned or anticipated occupancy level of 68% ± 18%. Not only are these figures higher than expected, but the range makes it difficult to pinpoint optimal future occupancy levels.
Respondents recognised a mid-week peak, with current occupancy levels reaching 33%. The peak is expected to reach around approximately 50%. Organisations with pre-Covid hybrid working are expected to cope better with the peaks.
In general, greater variations and uncertainties in utilisation create a higher management burden compared with the certainties that accompany high and predictable utilisation.
Based on the information collated, it appears that, previously, 10 ± 2 m2 per person was the ballpark recommended planning density, where the ‘person’ represents the number of people present rather than the assigned headcount.
Coincidentally, interviewees offered a range of 10 ± 2 m2 per desk, mostly based on 1:1 desking, and acknowledged that densities will reduce if the office is not fully occupied. Survey respondents indicated that current office densities are 9.0 ± 2.4 m2 per desk, and planned densities are slightly increased at 9.4 ± 2.4 m2 per desk, based on 113 paired responses.
Implications for the BCO Guides
Historically, density is associated with headcount per desk. In a more agile work environment, there is a difference between space per person and space per work point. Consequently, the report found that measuring density in m2 per occupant was more relevant than m2 per desk.
Most of the research shows that high density environments affect comfort, wellbeing and performance, but that with good design investment and careful management, these impacts can be mitigated.
It is expected that office space requirements will reduce in the future. The report suggests that those supplying larger developments and office buildings may find themselves under increasing pressure to subdivide floors as space requirements are lessened.
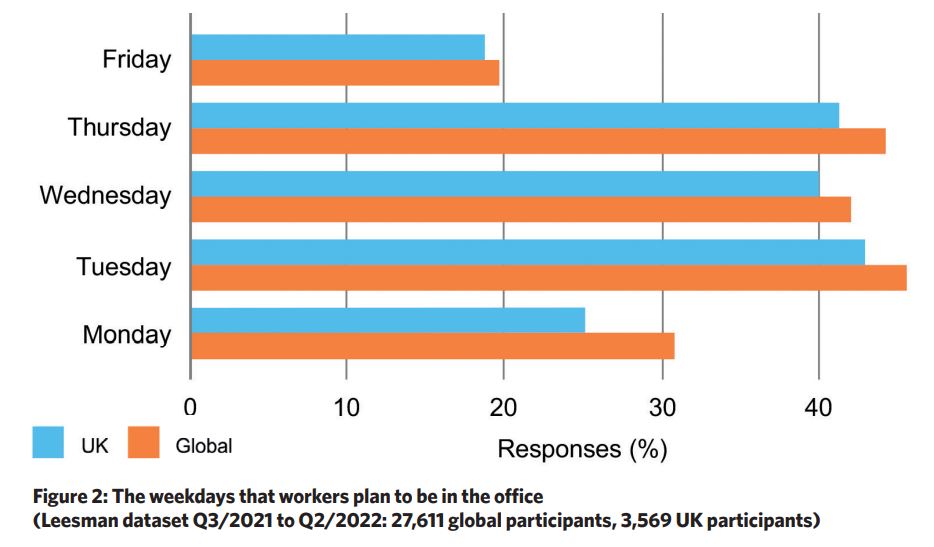
The analysis found that many organisations are reluctant to mandate the workdays on which employees should use offices as opposed to remote locations. This creates distinctly different high and low values of actual daily occupation. Occupiers are looking at those scenarios that will place pressure on their offices on particular days.
There will be days when occupancy levels will exceed the average. Equally, there will be other days when occupiers that are pursuing a net zero carbon agenda may want to cordon off areas or floors and rationlise their use.
The report says that to help mitigate the risk of insufficient base-build elements, a 10m2 per person starting density with a peak occupancy of 80% might be assumed, such that the effective density increases to 12.5m2 per person. For buildings with higher occupancy levels on the non-desk floors (for example, footfall due to visitors), an occupancy level of 100–120% or more may be required.
Following the study, no single density figure is offered by the BCO, rather a guide on key factors that impact on space and density, relevant to the density of specific workplaces. A density suggestion of 10m2 per person is given, a ballpark figure for a starting point at the build-base stage of office design. This can be adjusted for the needs of the organisation, dependent on the activities the space will be used for.
References:
- Office Occupancy: Density and Utilisation, BCO 2018 bit.ly/CJNov22BCO1
- BCO (2022) BCO Guide to Specification Key Design Criteria Update 2022: A Position Paper.
- Leesman (2022) Leesman+ Certification. Available at: bit.ly/CJNov22BCO2