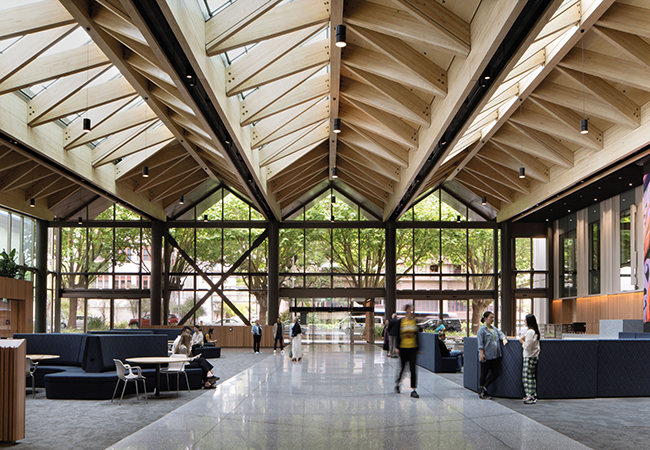
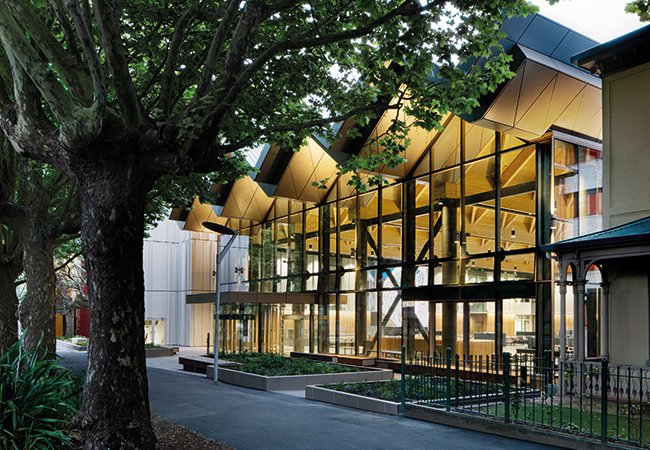
The redevelopment of the University of Auckland’s B201 building (submitted by Beca) was the 2026 CIBSE Building Performance Champion
The CIBSE Building Performance Awards (BPA) are increasingly becoming more than a celebration of good projects: collectively, the entries provide a valuable snapshot of how buildings are performing and how the industry is responding to the challenges of energy, carbon and building performance.
Every year, CIBSE reviews the previous year’s entries. This informs updates to the categories, criteria and data-collection forms introduced in 2021, and is an opportunity to review building performance across the projects.
This year’s analysis confirms that the quality and scope of building performance data keep increasing, with fewer areas of data uncertainty and wider coverage of building performance. The majority of entries now provide data that is complete and reliable enough to estimate the building’s energy use intensity (EUI) with reasonable confidence, even when onsite generation is present (see infographic, right).
This is a marked improvement from a few years ago, when photovoltaics (PVs) often led to some uncertainty about the amount of renewable energy generated on site and/or used by the building, preventing a full EUI from being established.
District heating, however, continues to prevent a complete assessment of the building’s energy use and associated carbon impact. This is because, typically, only heat delivered is known, not full energy used to generate and distribute that heat or the carbon content of the heat.
Of the 22% of entries for which EUIs were not based on reliable information, two-thirds were because of ambiguous data from district energy systems. CIBSE has been advocating for the upcoming heat network register to include this information, so that the full impact of networks can be publicly available.
New categories for the 2026 BPA Awards
The following categories were introduced at the 2026 awards, to encourage and reward innovation, and to recognise efforts beyond individual buildings:
Building Performance Evaluation: Practice – winner: Willmott Dixon for its Energy Synergy service, which monitors operational energy and aims to close the performance gap.
Building Performance Evaluation: Products and Innovations – winner: Swegon’s WISE demand-controlled system, which enables energy savings while allowing users to follow actual performance.
Portfolio of the year – winner: SRE, for the Bourn industrial estate, which impressed judges with its long-term carbon trajectories and tenant engagement on operations and low embodied carbon fit-outs.
Building performance: key statistics
As in the previous year, the entries (for both new and existing buildings) tended to have much lower energy use than the average building stock. While only a high-level comparison is possible, some projects approached or met the UK Net Zero Carbon Buildings Standard (UK NZCBS) v1 energy use limits, despite having been designed many years before its publication. This is particularly the case for new-build offices, often informed by NABERS ratings.
Renewable energy generation showed a wide variation across projects, with some very limited installations and others meeting or exceeding the UK NZCBS targets.
An increasing number of projects reported having carried out an embodied carbon assessment for the whole building (see infographic, right). The assessment of building services is still a weak point, but this should improve in future years as Project of the Year entries are operational buildings and, therefore, reflect design practices from several years ago.
Where reported, the embodied carbon impact varied widely, with some projects well below or above the UK NZCBS limits. It is hoped, by providing a reference point for most sectors and project types, the UK NZCBS will encourage wider reporting, as well as lower impacts.
The entries also show a huge variety of refrigerants. R32 (GWP 675) was the most common and is where the UK NZCBS limit is set. However, nine other refrigerants were used across all entries, ranging from CO2 (GWP 1) and R1234ze (GWP 7), to refrigerants with much higher impact, such as R410a (GWP 2088).
Water use has only recently become part of the ‘Essential information’ on the entry form, so limited data is available. It is notable, however, that among the office projects where it could be estimated, daily usage was very similar in most projects, between 9 and 11 litres per person, except one outlier at nearly 24 litres per person.
Looking ahead
The evolution of entries over time suggests two encouraging trends. First, building performance data is becoming more complete and reliable, allowing more meaningful comparisons between projects. Second, attention has shifted from new buildings to existing ones, and from individual buildings to portfolios. Increasing attention is being paid to previous blind spots, such as embodied carbon, and to issues previously ‘too hard to tackle’, such as liaising with tenants on energy use and fit-out resource use.
There are still important gaps, including data on district heating performance. Refrigerant choices also demonstrate the continued importance of looking beyond operational energy when tackling whole life carbon.
As the awards evolve, the value of the data collected should grow. The aim is not simply to identify the best-performing projects, but to understand what they can tell us about the wider direction of the industry – and where further improvement is still needed.
Summary of UK entries on awards shortlist
35% Projects using Soft Landings or similar activities (last year: 20%)
64% Projects using energy performance modelling such as DfP, TM54 or PHPP (last year: 60%)
50% Projects stating energy performance targets at design stage – for example, NABERS (last year 47%) of which 71% were contractual/linked to funding
50% Projects using onsite renewables. The figure was 83% for new builds – all PVs (last year: 67% overall; 57% new build). Average output – around 74kWh·m–² per year
78% Projects stating they had a form of post-occupancy evaluation (for example, IEQ monitoring) beyond just energy use (last year: 93%)
71% Projects that are all-electric (last year: 47%), including where gas was removed. The remaining were either on gas or heat networks
78% Entries for which energy use intensity was considered to be based on reliable and complete information (last year: 45%)
57% Entries with an embodied carbon assessment of whole building, though some had not assessed building services (last year: 40%)
ABOUT THE AUTHOR
Julie Godefroy is CIBSE head of net zero and chair of CIBSE Building Performance Awards