
People are a problem. The humourist Guy Browning wrote that most problems in life are people problems, and most people problems are communication problems. If you want to solve a communication problem, he said, go give someone a damn good listening to.
The key to understanding what people experience in buildings is to ask them clear, unbiased questions. The more abstract, enigmatic, or technical a question, the greater the variation in the answers.
This is compounded by the fact that humans are emotional, diverse and perverse. This makes accurate surveying of building occupants tricky. (Read Roderic Bunn’s Ten classic problems with occupant survey research).
Hence the market for environmental instrumentation. Reliable, low-cost, and accurate digital devices can measure most environmental parameters. Their drawback is an inability to record conditions as perceived by humans. Nor can they rank trade-offs that humans make, such as between ventilation and external noise, or ventilation and draught from an open window.
Ultimately, it is human perception of conditions that determines comfort and motivates behaviour, such as opening or closing a window, not an instrumented value. Like an ill-fitting suit, instrumentation and perception data tend to fit only where they touch. It’s why proof of causal links between measured environmental parameters and productivity remains elusive.
Anyone can design a survey, but the difference between a bad questionnaire and a good one is the difference between a novice and a virtuoso. Most people can bash out Chopsticks on a piano, but performing a concerto is another level. When it comes to creating a good survey, there is simply no substitute for formal study and experience. Conversely, a badly designed survey risks leading you to jump to the wrong conclusions.
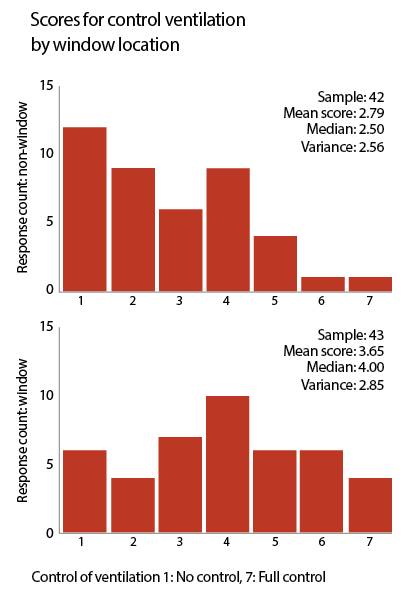
Figure 1: A good-practice example of how to show data in stacked histogram format to illustrate differences in ventilation control perceptions between window and non-window seats. All statistics are given for total clarity. Note that spatial differences can lead to skewed or flat (non-normal) distributions. This is not a failing, rather a normal characteristic of occupant perceptions. An understanding of what the data is saying requires the researcher to have a full grasp of the building’s physical context
Creating a questionnaire
Rule One: read a book on how to do it. There are many guides on designing social surveys.
Rule Two: Be clear what your survey is about. Do you want it to be specific or cover a wide range of comfort factors? The best surveys are those that have a particular research focus, be it thermal comfort, acoustics or health (see Figure 2 ‘A map of typical occupant surveys’). It’s possible to develop a general built environment questionnaire, but it takes talent to avoid breaking Rule Three, which is: keep it short. Respondents start to suffer survey fatigue after three A4 pages or web screens.
Rule Four: Test your survey before unleashing it on the world. Practise it with volunteers and ask them what they thought the questions were about. Only a couple of people in any one survey might express misgivings about a particular question you’ve posed, which is why it takes 10 or 20 surveys before a consistent pattern of confusion emerges. Once realisation dawns, you’ll have to bin the data you’ve gathered, shortly followed by the offending question.
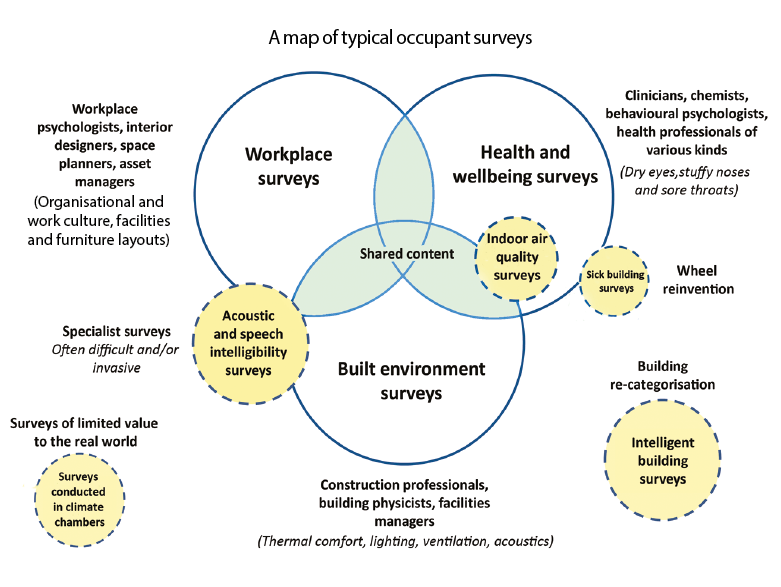
Figure 2: Below shows the different forms of surveys used in building performance analysis, the professionals who tend to develop and use them, and how their questions tend to be themed. Inevitably there is overlap. Some survey systems are specialised, such as for acoustics, or are a subset of another theme, for example, those studying ‘sick building syndrome’
Survey scales
Survey designers use scales to elicit occupants’ graded perceptions of comfort and functional factors of buildings. The simplest scale is the yes/no binary choice. That suits factual questions, such as whether or not a respondent sits by a window, but it’s not very insightful for obtaining a range of views. Hence the use of Likert scales and semantic differential scales (see Figures 3-5).
Two rules here: be consistent with your scales so scores from different questions can be compared. Also, uneven scales, such as 1-5, 1-7 or 1-9, provide a midpoint for respondents to give a neutral response. Even scales (e.g. 1-4, 1-6) that force respondents to respond either negatively or positively will bias the data.

Figure 3: An example of a semantic differential bi-polar rating scale used in many occupant surveys. So-called, as the respondent is required to translate their subjective perceptions of a range of conditions into a numerical score. This enables direct translation of perceptions into statistics. Used notably in the Building Use Studies (BUS) occupant survey
Overall, seven-point scales offer the best balance for a respondent to express their perceptions and enough resolution for statistical analysis. Scales above nine-points may create doubt about which box to tick, which raises the chance of scoring by guesswork. That increases the variance in responses which consequently reduces the underlying precision in the averaged scores (and thereby reduces the explanatory power of the statistics), without the surveyor being aware of it.
Survey questions must also be suited to the respondent. Construction professionals are more knowledgeable about technical topics than building users who may only be able to describe discomfort symptoms and are unable to link them to specific causes. The use of technical terms in a question, such as ‘acoustics’, ‘occupant density’ or ‘ICT’ may
be misunderstood or misinterpreted.
Scale labels must be true antonyms – for example, unsatisfactory/satisfactory, or too cold/too hot. Using scale labels that are not opposites is the equivalent of combining two questions into one. For example, ‘interferes’ is not the opposite of ‘enhances’, yet this appears in a well-known questionnaire.
Text boxes
Comments in surveys are usually far more insightful than scores. Most questions should be equipped with a (preferably small) free-text box so that people can qualify their scoring.
There can be a difference between what respondents score and what they say. Scoring will be driven by the questionnaire’s themes and your choice of questions. Text boxes, however, give respondents free rein.
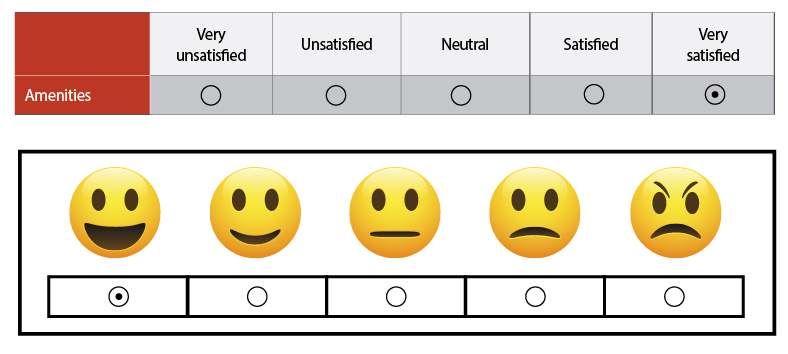
Figure 4: Examples of abstract response scales using terms or icons. This is a form of attitudinal or Likert scale, with or without numerical references. Many built environment surveys favour these scales, as scaling intervals based on emotions are believed to help respondents rank their subjective feelings towards conditions
Carrying out a survey
Success depends largely on how a survey is carried out. Raise awareness among building occupants so they welcome you with open arms rather than indifference or resistance.
High survey response rates require honed communication skills. Be polite but insistent when asking people to take part. Changes to data protection legislation require respondents to opt in formally.
Surveys should be carried out over a single day, in case conditions change. You need enough resources to hand out and gather up paper questionnaires. One person can feasibly survey 500 people in a day. For populations above 600 people – or multiple tenancies above 300 in total – budget for two surveyors.
You should always aim for a 100% response rate of the people in the building on the day. Be pleased with anything above 80% and content with 60% and above. A 40% response rate will generate shaky statistics.
Web-based surveys may be needed for large buildings, or those where access or security is an issue. Elsewhere a paper-based survey should be the default. It may require more work, but you get to speak to the occupants directly, and you experience the building yourself.

Figure 5: A version of a semantic differential scale where a respondent is required to select their opinion on a seven-point scale between two polar adjectives (not shown). The green and red tinting implies a sliding scale between good and bad. This scale is used in the CBE survey available from Berkeley University California (certified by Well and Leed, so has the same status as BUS)
Web-based surveys tend to generate lower response rates than paper-based surveys, which is why some people devise incentives. However, any form of incentive, such as prize draws, runs the risk of introducing hidden bias in responses. It might also motivate people to cheat – for example, some people might use multiple email accounts to increase their chance of winning a prize.
Keep data analysis simple. There are many analytical and statistical tests suitable for survey data. However, as respondents are delivering whole integer scores on a small categorical scale (for example 1-7), attempts to transform it in any way might fatally distort it. Some surveyors indulge in complex transformations to turn non-normal distributions into normal distributions (bell-shaped curves) so the data is parametric. However, in building studies, non-normal distributions describe how occupants perceive actual conditions. They are insightful distributions. Normalising them is unhelpful.
The mean value of a distribution and its variance (a measure of data dispersion that may be insightful) should be calculated, and always reported in any graphs along with the sample size (Figure 1).
Free-text analysis
Comments are best kept in their original form rather than subjected to some form of thematic analysis, as comments can easily be re-categorised into themes chosen to suit the ambitions of a researcher. Again, this is a form of bias. In any case, thematic analysis is best for longer tracts of feedback.
Word clouds are often used to display comments. They are compelling to look at, but these can be prone to error if no attempt has been made to resolve subtle differences, such as ‘too hot’ and ‘a little hot’.
It may be insightful to categorise free-text responses as positive or negative, with a balanced category for any comments that are neutral or only mildly critical. People are generally more motivated to complain rather than to praise. People who are happy generally don’t make comment.
Which brings us back to the beginning: ask people a sensible question and they tend to give you an honest answer. It may not be the one you want or the one you expected, but that’s why perceptions gained from occupant surveys are so important: they tell us what we need to know, not serve to confirm the surveyor’s expectations.
Further reading:
Analyzing Social Science Data, Sage Publications, De Vaus D (2002)
Surveys in Social Research, 5th edition, Routledge, De Vaus D (2002).
Qualitative Research Practice, NatCen, SAGE (Second edition), Ritchie, J., et al. (2014)
■ Dr Roderic Bunn is a consultant in Soft landings, energy analysis and occupant surveys.
Five bad survey practices
1. Leading questions or statements, such as ‘I am often too cold in winter’. This can motivate survey respondents to give negative responses – a characteristic known as ‘acquiescence bias’. Leading questions followed by a multiple series of questions of discomfort (as in ‘tick all that apply’) can serve to exaggerate the seriousness of a discomfort problem. Some researchers do this deliberately to get the answers they want.
2. Mixed scales are pointless, and scales without midpoints deliberately incite bias.
3. Scale labels that presume a problem as in ‘slight problem/major problem’. Wherever a respondent scores, it’s still classified as a problem.
4. Combining multiple variables in a single question where the respondent can only respond once (for example, satisfaction with catering and toilets).
5. Questions that ask respondents whether they are ‘satisfied’ with a singular and obviously negative characteristic, like draught, when they should be asked to rate between two opposed conditions, eg stillness and draughtiness.