
Located off Regent Street, London, is the site of 1 and 2 St James’s Market, a joint venture between The Crown Estate and Oxford Properties. It comprises two buildings – with 19,500m2 of office accommodation, six flagship stores and seven restaurants – set within revitalised public spaces, including a new square and art pavilion. The project included the installation of a full metering system to comply with Part L of the Building Regulations and to meet the operational requirements of the property after completion. Carbon2018 was commissioned as metering consultants, and the metering strategy review requirements, throughout all stages of the project, were clearly defined at the outset (see Figure 1).
Metering strategy
Step 1: Objectives – Determining the desired outputs
Objectives and desired outputs underpin any successful metering strategy. When setting out the objectives, it was necessary to engage with all stakeholders, including: the design team; the main electrical and mechanical contractor, and appropriate subcontractors; the managing agent; and Carbon2018.
Step 2: Select the metering boundary
It was important to ensure energy use was captured across the whole St James’s Market site, including the square’s external lighting. The metering was to encompass electricity, gas, heating, cooling and water for the services that fall within the boundary line (see Figure 2).
Steps 3-4: List all energy imported and exported across the boundary, and all energy-using items within the boundary
Each of the two buildings has its own incoming utility supplies and central plant services; from an energy perspective, there is no cross-over between the properties. Both buildings have photovoltaic (PV) solar panels on the roof, and 1 St James’s Market has a combined heat and power (CHP) unit, so there is generation of power on site. The capacities of this equipment have been sized to support the buildings’ base-load power, and there will be no export of energy back to the grid. The only energy crossing the boundary is from the incoming gas supply and grid power supply to each block.
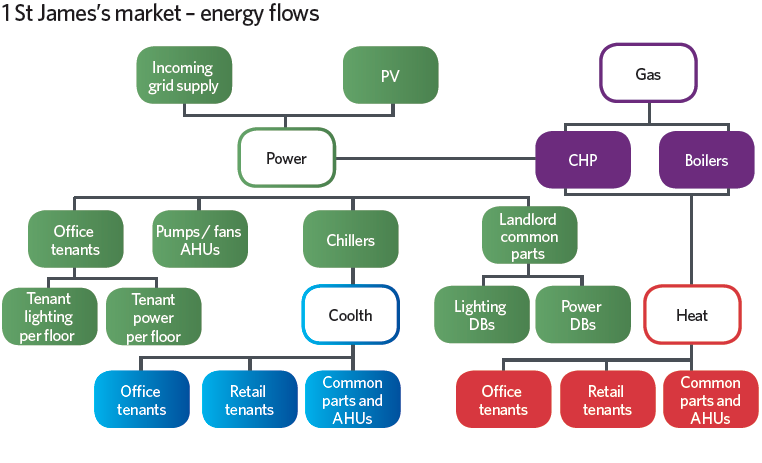
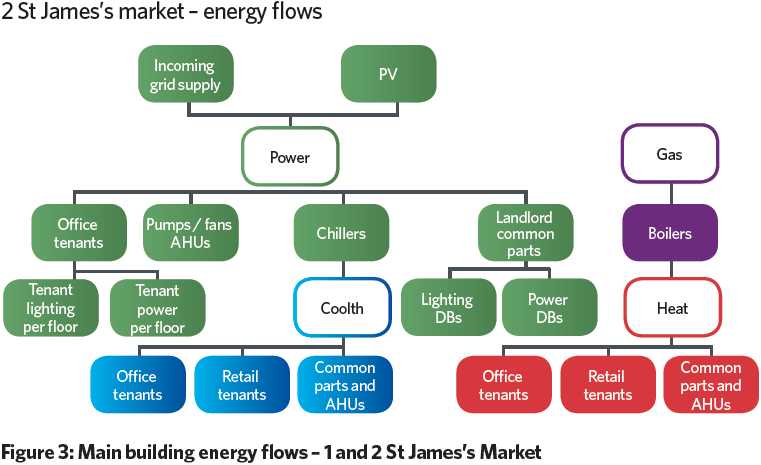
A list of the main end-use categories inside the boundary was developed and the typical energy flows through the building identified (see Figure 3). This included inputs and outputs of central plant where transformation of primary energy to secondary energy takes place. Following the energy flows through, it was clear that the CHP adds complexity to the meter requirements, as gas is used on site to generate heat and power, and the quantities of each needed to be tracked.
Step 5: Decide which items to meter
The initial metering strategy was developed as part of the base-build electrical and mechanical design. At this stage, the scope appeared comprehensive, with 90% of the energy for end-use categories metered and heat meters for the floors. The strategy included: electrical meters to record power and lighting; heat meters for low temperature hot water and chilled water energy use; water meters; and oil meters for the standby power capacity offered by the generators. A review was done and further meters added to ensure all objectives were met.
Step 6: Select meters and the automatic meter-reading (AMR) system
Meters approved by the Measuring Instruments Directive (MID) were chosen, as the property will be multi-occupied, so has a requirement for the re-charging of energy costs. Additional considerations were:
Electricity meters:
- Meters that meet, as a minimum, IEC 62053-21 accuracy class 1, and current transformers (CTs) meeting IEC 61869-2 class 1 accuracy, were selected because of the importance of high accuracy for billing
- The registers provided by different models of electricity meters
Heat meters:
- Inline, ultrasonic-type heat meters were selected because of their accuracy
- Meters were bought as a single package – inclusive of flow part, temperature probes and calculator – to ensure there were no issues with compatibility, and calibration of the calculator, with the other components
- Meters were sized according to flow rate, to ensure they record accurately, as mechanical meters specify minimum and maximum flow-rate thresholds within which they will operate correctly.
The AMR systems had to be able to pick up pulse outputs from the water and gas meters, and Modbus protocol from the electricity and heat meters. A hardwired system was chosen to ensure reliability of communications between the meters and logging equipment.
A connection was made to the internal LAN system, which has a broadband link to enable remote access and export of data. Separate onsite head-ends were supplied, specific to each building. A dashboard function allowed the onsite building manager to analyse and manage energy on a day-to-day basis.
Step 7: Decide on location of meters
The meters on the main office floors were located within the risers, for easy access. They could be found in the same position on each floor, at a height that allows readings to be taken without the need for stepladders. Additional meters – within the plantrooms and electrical switchroom – were also in easily accessible areas. For mechanical meters, consideration was given to orientation, to ensure they are at the most appropriate angle to be read while complying with the installation requirements.
Step 8: Review the metering strategy
A full review was completed at design stage, with input from all stakeholders who would need to use the data output. Several reviews were undertaken during the project, as illustrated in Figure 1. This was important because modifications were made that had a knock-on effect on the metering. The initial review focused on the position of the metering, but – as the project progressed – it was necessary to review the type of meters being used. Technical submissions were analysed and approved to ensure they met the agreed requirements. Commissioning procedures were also examined to ensure they reflected the specific meters installed, and that building users were left with a system that delivered in practice. Agreed changes and updates were clearly documented, with amendments made to the drawings and schedules.
Step 9: Implement and commission the metering
Most manufacturers stipulate that flushing water-based systems during commissioning could damage heat meters, so flushing is typically done with spool pieces installed. These are replaced with meters once flushing is complete and, as a result, meters are often one of the last items to be completed and commissioned. Independent checks were carried out by Carbon2018, to verify that meters had been correctly installed and commissioned, and were in line with the specification developed during the project. Any issues were logged, with an agreed action and timescale, and then rechecked after remedial work. Periodic meter verification will be done, to ensure their accuracy is maintained.
Step 10: Document the strategy
Full documentation relating to the metering system was drawn up for inclusion in the logbook and operation and maintenance (O&M) manuals. This included:
- A full meter schedule
- As-installed schematic drawings, with meters labelled to match the schedule and AMR system
- Floor plans indicating the physical location of the meters and data-collection devices, for ease of ongoing maintenance
- Meter data sheets and technical information
- Commissioning records for each meter.
About the author
Joanne Merry is technical director at Carbon2018