Current methodologies to account for the carbon emissions of combined heat and power (CHP) could be more accurate. The environmental performance model of the Building Regulations’ compliance tools – which look at average carbon emissions from the grid – is probably undervaluing CHP’s carbon benefits, and, potentially, those of other onsite-generation and demand-reduction technologies. The Association for Decentralised Energy’s (ADE’s) new electricity dispatch model shows how we could represent the value of CHP by reflecting optimisation strategies developed by generators and suppliers in energy markets. It argues that CHP helps address periods of high electricity-grid carbon intensity, and proposes a solution to reflect CHP’s impact and benefit.
In 2016, high-efficiency CHP generated 6.3% of the electricity and 5.9% of the heat produced in the UK. CHP integrates the production of usable heat and power (electricity) into one efficient process. Capturing waste heat using CHP can increase fuel efficiency by up to 30%. Small CHP applications in buildings – or larger CHP systems connected to heat networks – generate heat and electricity locally, to supply commercial, domestic and public buildings. CHP’s fuel-efficiency benefits – no matter what the fuel – are widely accepted, as it displaces other forms of generation (Figure 1). However, as the UK electricity grid decarbonises, there are debates about how much carbon CHP using natural gas saves.
Emissions reduction investments in buildings
The UK has a target to reduce greenhouse gas (GHG) emissions by 57% between 1990 and 2030. Three-quarters of the GHG emissions reductions since 2012 have been the result of reduced burning of coal for electricity production.
Government statistics show that the coal-fired share of power generation was about 9% at the end of 2016 – its lowest level to date. This suggests further emissions-saving opportunities from reducing coal in the power-generation mix are limited.
However, emissions have increased in the building sector over the past two years, according to the Committee on Climate Change. Heat is the main form of energy used in buildings – around 80% – so an increased focus on the decarbonisation of heating is necessary to meet the carbon target.
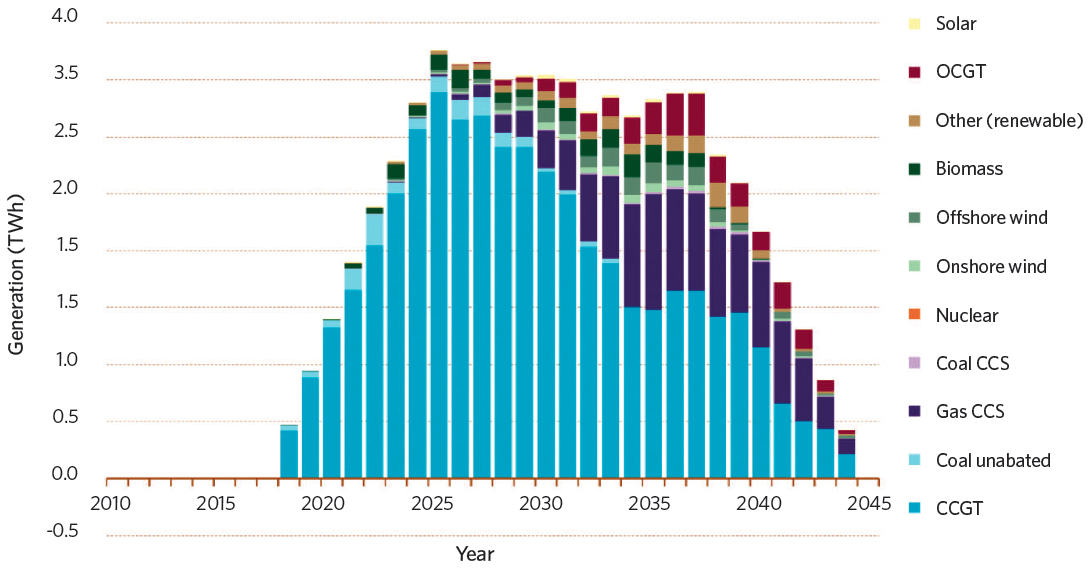
Figure 1: Generation displaced by additional gas CHP capacity +0.5GW scenario. LCP analysis for BEIS 2 Source: Industry
A building developer’s choice of energy supply is influenced by economic viability and environmental performance. They need to demonstrate that new buildings meet a certain level of energy efficiency and emissions reductions to comply with Part L of the Building Regulations on the conservation of fuel and power. The tools used to assess energy use and carbon emissions against the requirements of Part L are the standard assessment procedure (SAP) for domestic buildings and the simplified building energy model (SBEM) for non-domestic buildings. SAP and SBEM have functionalities to assess all types of energy supply – from large utilities delivering gas or electricity to end users, to onsite energy supply by a local system. However, these are very different options because of the avoided network losses from local systems and the ability to turn on additional CHP capacity during periods of peak energy demand.
The methodology assumptions used in SAP and SBEM are decisive for the future of CHP in the building environment, and it is important to ensure a fair reflection of local CHP’s impacts and benefits.
Emissions reduction from gas-fired CHP
On sites where there is both a heat and power demand, CHP is often the preferred solution, and every design seeks to optimise users’ benefits. Small CHP units can offer significant flexibility by following loads (see Figure 2).
To calculate the energy and emissions savings from gas CHP, energy outputs – heat and power – need to be accounted for. SAP and SBEM assume that a unit of electricity from CHP displaces a unit of electricity from central power stations – and a unit of heat displaces a unit of heat raised by gas boilers – to determine its carbon impact. The challenge of calculating the fuel and emissions savings associated with displaced grid electricity is that grid electricity is generated by a large number of central power stations with different fuels and varying efficiencies.
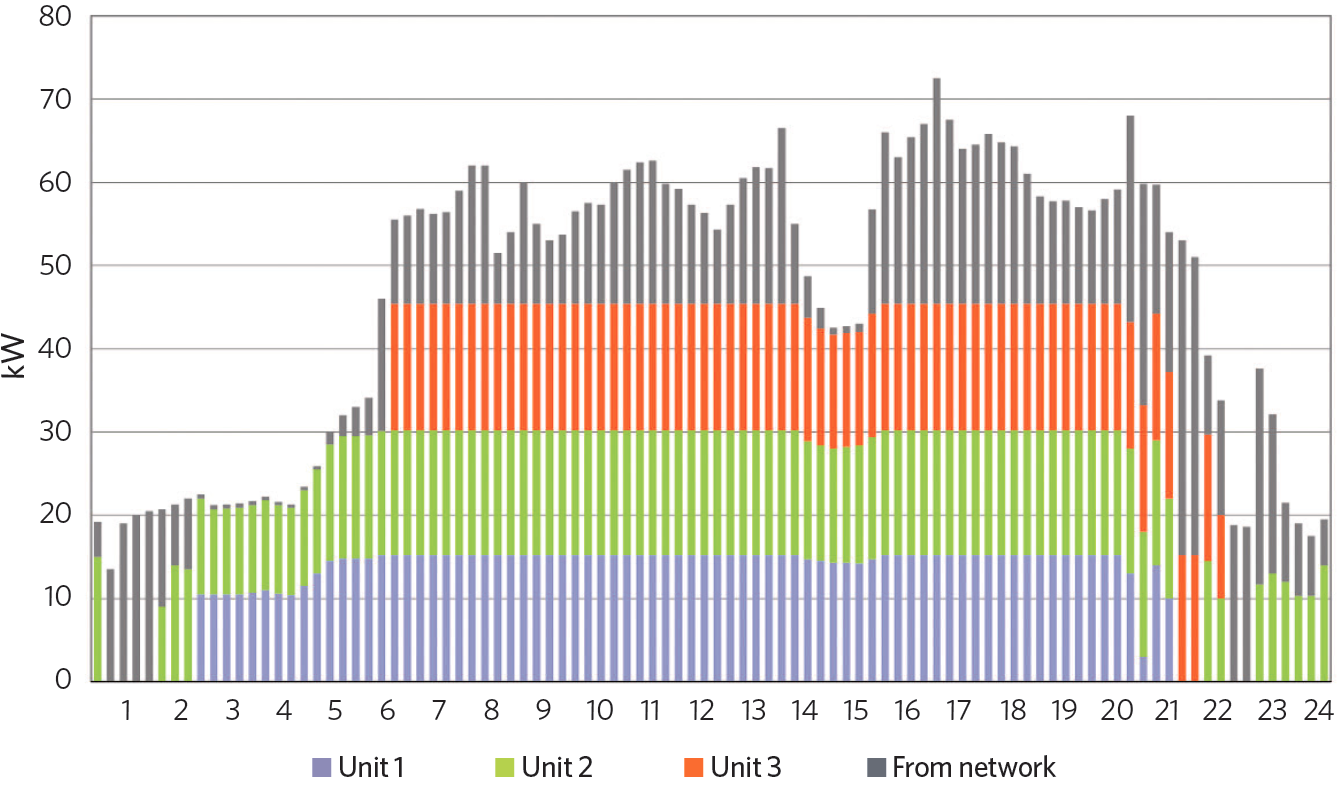
Figure 2: Combination of small CHP units following electric loads. Source: Industry
Electricity generated from coal contains around 0.94gCO2e per kWhe, while a unit of electricity from wind energy is nearly zero carbon. So the sources that are reasonably expected to be displaced must be determined to estimate the displaced fuel use and emissions.
Currently, SAP and SBEM assume that a unit of electricity from CHP displaces a unit of electricity from all the power stations on the grid, and is calculated using government projections of the fuel mix and the Business, Energy and Industrial Strategy (BEIS) factors over a three-year period.
However, the electricity system’s carbon emissions factor varies on a short-term basis, depending on the mix of power plants meeting the loads (see Figure 3). It also means any reduction in demand or increase in generation displaces not an imaginary average power plant, but the marginal power plant – the last one in the merit order.
ADE analysis using a power system dispatch model suggests that, largely, gas CHP only displaces other gas power plants and rarely displaces intermittent renewables or nuclear.
Dispatch modelling of gas CHP in the UK electricity grid
The ADE power dispatch model seeks to replicate how the electricity system works. It uses CHP operation profiles from the domestic and commercial sectors, plus government, National Grid and trading platform sources.
Figure 3:ADE analysis, generating plants meeting electricity demand on the transmission system, ranked by priority of use. Source: Elexon
To minimise the overall cost of delivery in the wholesale electricity market, suppliers with access to several power plants will decide which one to purchase from, based on the plant’s marginal operating costs. If the wind is blowing, suppliers will prefer to use electricity from wind farms – nearly zero marginal operating cost – to meet as much contracted output as possible before turning to fossil-fuel plants. This determines the merit order – a way of ranking available sources of electrical generation based on their relative short-run marginal costs.
The generations at the bottom of the stack in Figure 3 – for example, wind, hydro and nuclear – generate at the maximum of their capacity given their availability, and have a downward effect on the average carbon intensity of the grid. In contrast, the plants at the top of the stack – open-cycle gas turbines (OCGT) and coal power stations – vary their output to meet load variations, pushing the average grid carbon intensity up. The plant with the highest marginal cost over a settlement period is the last one in the merit order, or the ‘marginal’ plant. As a result, when renewable generating plants supply most of the UK’s electricity load from 4am to 5am, the carbon content of the grid is very low. From about 4pm to 8pm – when outputs from the plants with lower running costs are not enough to meet the load – the carbon content is much higher.
ADE analysis of the relative marginal cost of generations over the calendar year 2016 suggests that CHP plants following the merit order produce lower marginal-cost electricity than combined-cycle gas turbines (CCGTs) because of its fuel-efficiency benefits, and would be represented by a slice below CCGTs’ output. By following the merit order, CHP’s power output will rarely displace renewables’ output. This differentiation is very important when we think about the appropriate quantification of the energy and carbon-emissions savings from CHP, and understanding how to define its carbon-value proposition.
Conclusion
Clearly, there is scope for variation in how the CHP counterfactual – or generation displaced – is determined, and this has a significant impact on the carbon savings. These different pieces of quantitative analysis show that gas CHP’s real-world operation does not displace an imaginary average power station, but a CCGT or other marginal power plant.
In the older electricity system, this issue was not important because the difference in emissions between the average power plant and the marginal power plant was relatively small. But, in an increasingly flexible, decarbonised system, the difference will become material, and the time of day or year that an action is taken will have an enormous impact on the level of carbon savings.
CHP contributes to improving the efficiency of the energy system for the benefit of householders, small businesses and public authorities, as well as industry, while contributing to grid stability and the integration of renewable energy. SAP and SBEM could better reflect its value by using the marginal carbon-emission factor, based on the position of CHP in the merit order.
- Hanaé Chauvaud de Rochefort is senior policy research manager at the Association for Decentralised Energy
References:
- Digest of United Kingdom Energy Statistics, Chapter 7 CHP, BEIS, July 2017, p1, ADE analysis for the share of UK heat loads from CHP.
- Modelling the impact of additional gas CHP capacity in the GB electricity market, LCP, 2014
Digest of United Kingdom Energy Statistics, Chapter 1 Electricity, BEIS, July 2017, p1. - Meeting carbon budgets: closing the policy gap, Committee on Climate Change, 2017, p2.
- Defra conversions factors 2017, on a NCV basis
- CO2 and primary energy factors for SAP, BRE technical paper CONSP-07, p18.
- Lightening the load: how CHP helps win the global race for a competitive, low-carbon economy, 2017.