
There is a lot of focus on the role of ventilation in reducing the risk of far-field (>2m separation) transmission of the SARS-CoV-2 virus in indoor environments. However, ventilation is not the only mechanism for removing viable virus from indoor air. Others include the biological decay of the virus and the deposition of aerosols onto surfaces.
These removal mechanisms are space-volume dependent. This means that, in spaces with a larger volume, the equivalent ventilation rate is higher, assuming the number of occupants – and the airflow rate per person (L.s-1 per person) – is the same. Consequently, the steady-state concentration of viable viral laden aerosols is also lower.
One of the reasons it is not straightforward to set ventilation rates to mitigate secondary transmission risks is that space volume matters. Here, we try to explain why this is the case:
Steady state concentration
We tend to use two metrics to quantify airflows, either a volume flowrate (L.s-1 or m3.s-1) or an air change rate (h-1). When a pollutant is continuously released into a space, its concentration eventually plateaus and reaches a steady state, and the two airflow metrics reveal different characteristics about it.
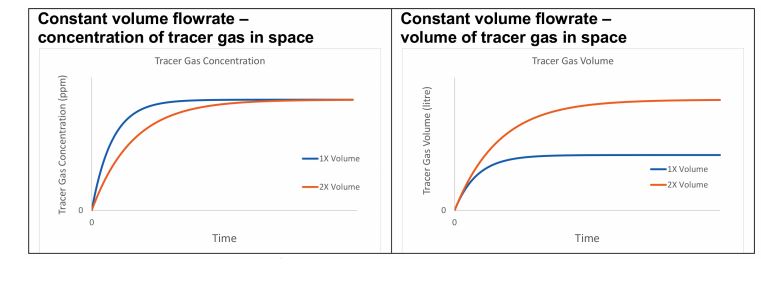
Figure 1: Two offices with different volumes ventilated with the same constant volume flowrate
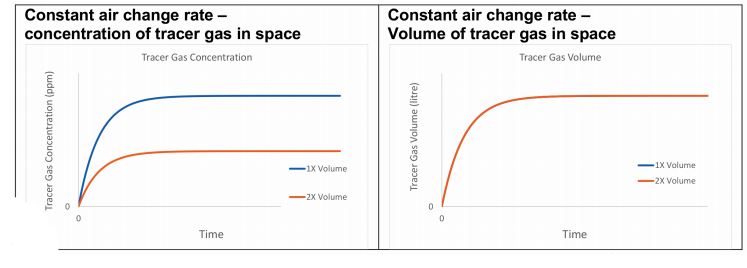
Figure 2: Two offices with different volumes ventilated with the same constant air change rate
Consider a tracer gas whose sole removal mechanism is ventilation, which is released at a constant rate into two offices, where one has twice the volume of the other, and both are ventilated with outside air containing no tracer gas. If each office receives the same constant volume flowrate, the concentration of the tracer gas will reach the same steady state value in both rooms, irrespective of their volume. However, the number of molecules of the tracer gas (or the volume of the tracer gas) is greater in the larger space (see Figure 1).
Alternatively, if each office is ventilated at a constant air-change rate, the steady-state concentration of the tracer gas is lower in the larger space, but the number of molecules in each office is the same (see Figure 2).
By considering these principles, we can begin to explore the risk of far-field (>2m) SARS-CoV-2 transmission via virus-laden aerosols in indoor spaces:
Consider two hypothetical offices, both containing 20 occupants doing the same activity and with a floor-to-ceiling height of 3m. Office A has an occupancy density of 10m2 per person, giving a volume of 600m3. Office B has an occupancy density of 15m2 per person, giving a volume of 900m3.
Additional removal mechanisms
- Ventilation rate – the air change rate is a function of the ventilation rate and the space volume V
- Biological decay rate – a function of the half-life of the virus, the time for half of all viruses present in a space to become unviable when outside a host cell, and the rate of biological inactivation by devices such as UV
- Respiratory tract absorption – a small number of viruses may be inhaled by occupants of the space, some of which is exhaled; some may deposit in the respiratory tract and proportional to the concentration of viable virus in the air and the breathing rate of occupants
- Surface deposition rate – the rate that aerosols containing virus deposit on surfaces via ballistic deposition and momentum deposition, and is a function of surface area
- Filtration rate – the rate that aerosol-borne virus are filtered from the air by a mechanical device. Hereon, we assume no filtration is present.
Suppose there is a single infected person in each office, shedding the virus at exactly the same rate. Office A is ventilated at 10L.s-1 per person, giving a total airflow rate of 200L.s-1. Office B is ventilated at 7L.s-1 per person, giving a total airflow rate of 140L.s-1.
Assuming the air is well mixed, in which office do susceptible occupants inhale less viable virus on average?
Viable virus steady-state concentration
By considering the ventilation rate alone, one might assume that Office A is safer than Office B because it receives 1.43 times more outside air per unit of time and because the CO2 concentration is lower.
However, the virus is encapsulated in aerosols and is a biological organism, so there are additional removal mechanisms that work differently to ventilation, but whose effects can be expressed as an equivalent air change rate (see panel, ‘Additional removal mechanisms’).
The risk of a susceptible occupant of becoming infected is related to the number of viable viruses they absorb into their respiratory tract, and the dose required before infection occurs. The higher the concentration of viable viruses there are in a space, the more viable virus is inhaled, increasing the risk of an infective dose.
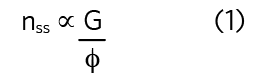
The steady-state quantity of any pollutant (number of molecules of a gas or number of viable virus) in a space, nss, is proportional to the quotient of the emission rate, G, and the total removal rate, φ, also known as the equivalent air change rate, expressed as an equivalent air change rate (h-1).
For a tracer gas whose only removal mechanism is ventilation, then φ = ψ, so, for the two example offices:
Office A ψ = 200L.s-1 or 1.2h-1
Office B ψ = 140L.s-1 or 0.56h-1
If the emission rate of the tracer gas, G, is the same in both spaces, the concentration of the tracer gas at steady state is lower in Office A because the volume flowrate is higher. The air change rate is also higher in Office A, so the total number of tracer gas molecules is lower.
The concentration of viable virus is proportional to the risk of inhaling an infective dose
However, for the SARS-CoV-2 virus, the contribution of the other removal mechanisms can be significant. We now consider the effects of biological decay, deposition, and respiratory tract absorption and typical values are given in Table 1.
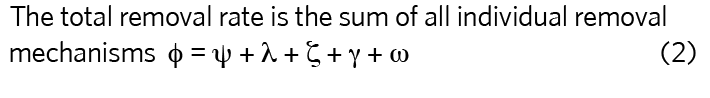
The effect of all the removal mechanisms can be summed into a single equivalent air change rate, φ, using equation 2. Its value is greatest for Office A (2.459h-1 compared with 1.797h-1), which means that the total number of viable viruses is lower in Office A if the virus emission rate is the same in both offices.
However, the concentration of viable virus is proportional to the risk of inhaling an infective dose and ‘not’ the total number. To compare the concentration of viable virus in each space, the equivalent air change rate needs to be converted to an equivalent volume flowrate, which is space dependent.
Carbon dioxide
Exhaled carbon dioxide (CO2) is only diluted by ventilation, so it is unaffected by the additional removal mechanisms described here. Interestingly, its steady state concentration is independent of space volume and solely dependant on the volume flowrate. Therefore, the risk of inhaling viable virus cannot be determined from a CO2 concentration. 2 However, a steady-state CO2 concentration is useful for identifying poorly ventilated occupied spaces. In some circumstances, it can be used to estimate the ventilation rate, but it cannot indicate the equivalent ventilation rate.
Office B has the greatest equivalent volume flowrate (449L.s-1 compared with 410L.s-1), so the concentration of viable virus is lower in Office B, despite having a lower ventilation rate (140L.s-1 compared with 200L.s-1). Therefore, the risk of viable virus depositing in the respiratory tract of a susceptible person is 8% less, reducing the likelihood of an infective dose on average, even though the steady-state CO2 concentration in Office B is around 20% higher than that in Office A. If offices are now ventilated at 10L.s-1per person then the equivalent ventilation rates are 410L.s-1 and 509L.s-1 for Office A and Office B, respectively.
The reservoir effect affects exposure
An indoor space can act as a fresh-air reservoir, which is useful for absorbing the impact of pollution emissions. The greater the volume of the space, the greater the effect (see Figure 1a). This reservoir effect means that the time taken to reach the steady state is longer in the larger Office B (volume of 900m3 compared with 600m3), thus susceptible occupants are also exposed to the steady-state concentration of viable virus for less time than in Office A, reducing their time averaged exposure.
This example demonstrates that the total equivalent volume flowrate that is the determining factor in assessing the concentration of SARS-CoV-2 virus-laden aerosols in an indoor space, that the outside ventilation flowrate cannot be used in isolation, and that the total equivalent volume flowrate is space-volume dependent. Space volume matters!
Note
In this example, the number of occupants is the same in both spaces and, therefore, the probability of an infector being present is the same. If the number of occupants is different, the probability of an infector being present changes – but that is another story!
References:
1 Jones, B. et al. (2020) Modelling uncertainty in the relative risk of exposure to the SARS-CoV-2 virus by airborne aerosol transmission in buildings, Building and Environment. 191:107617 doi:10.1016/j.buildenv.2021.107617
2 AIVC. Can a measured CO2 concentration show a building is SARS-CoV-2 safe? AIVC newsletter. November 2020. tinyurl.com/2daasfct
About the authors
Benjamin Jones is an associate professor and Chris Iddon is a research associate at the University of Nottingham