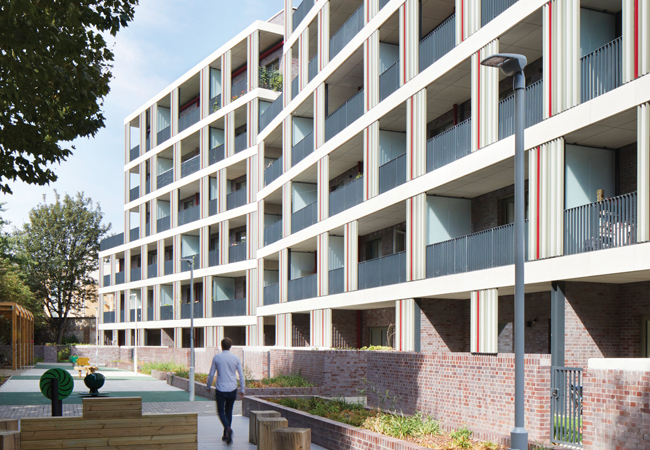
Agar Grove
Since their creation in 2012, the CIBSE Building Performance Awards have been based on monitored energy use data. With contractual and regulatory performance rising up the agenda, CIBSE has been looking at the past six years of entries to see what we can learn from building performance and data collection.
There has been an increasing number of resources and research on building performance data including CIBSE’s TM61-64 suite on Operational performance,1 the RIBA Plan for Use Guide 2021,2 and a new book on the lessons to be learnt from post-occupancy evaluations.
How to support building performance
- Comment on the draft awards data collection form by 6 May
- Submit in-use energy data
- Sign the Building Performance Network joint position statement on in-use performance:
- Look out for the BSI consultation on a new BPE standard, expected this summer.
We are looking to maximise the value gained from the awards data for applicants and industry and to identify whether projects could contribute to the CIBSE benchmarks database,3 especially at the low energy end of the scale. Ideally, we would like to showcase the projects on the platform (subject to agreement by applicants).
As well as making use of the data for the good of the industry, we would like to make the awards process simpler for applicants and are proposing a new data colletion form for those entering.4
For the moment, the exercise has focused on UK buildings and we have found 85 projects with good-quality data suitable for analysis. It could be expanded to other countries or regions.
What the review has told us about building performance
One of the aims of the data review was to identify best-performing CIBSE award submissions from 2016 to 2021 projects and compare them with industry targets from the RIBA 2030 Challenge5 target and LETI’s Net Zero Operational Carbon6 paper. The results are summarised as follows. The energy use intensity (EUI) targets include all energy used by the building, from the grid and on-site supplies, normalised to floor area.
Housing CIBSE award submissions
- LETI EUI target: 35kWh·m-2 GIA per year
- RIBA 2030 target: 35kWh·m-2 per year
Three individual homes met the LETI EUI (or almost, at 37 or 38kWh·m-2 per year). They included 2019 winner Lark Rise (it did have a wood burner fitted, but according to the architect has hardly been used).
All have Passivhaus certification and a heat pump – also the design strategy modelled when creating the LETI EUI. While energy use is undeniably low, they are also relatively large dwellings (above 150m2 GIA), which can make energy use benchmarked per m2 look better than it would per dwelling or per occupant.
The 2020 award winner, Agar Grove, scheme, is also Passivhaus certified and achieved exemplar electricity consumption and space heating demand, which is remarkable as it has much more ‘average’ dwelling sizes. However, it is served by block heating (gas boiler fed), which takes it well above the LETI EUI despite substantial work by the team which spent a lot of attention on reducing distribution losses; simple calculations indicate that with a heat pump system of average seasonal efficiency, it would likely have achieved the LETI EUI target.
Offices
- LETI target: 55kWh·m-2 GIA per year or 70kWh·m-2 NLA per year and/or DEC B (40) rating
- RIBA target: 55kWh·m-2 per year and/or DEC A rating
No office building among the award submissions met the LETI EUI, but 2018 award winner the Enterprise Centre came very close. It is Passivhaus certified and achieved exemplar electricity consumption and heating demand. However, it is served by district heating, and total energy use to meet that heat demand is not known to CIBSE at this stage. Simple calculations indicate that with an onsite heat pump system instead, it would likely have achieved the LETI EUI.
A number met the alternative LETI targets of DEC (B) rating. Energy use across the projects spans the CIBSE benchmark curve for offices (see Figure 1). High-rise, deep-plan commercial offices clearly tend to have higher energy use; this is sometimes accompanied by higher occupancy density, which could partly, but not always, explain it.
Inversely, some offices at the better energy use end of the scale have lower-than-average densities (around 8.5m2 GIA per occupant), but several also have average ones (around 10m2 GIA per occupant). Higher energy users overall often displayed high energy use for heating, which tends to further indicate that occupant density is not the main ‘culprit’ for high energy use, and points to a large potential for energy savings.
Schools
- LETI target: 65kWh·m-2 GIA per year
- RIBA target: 55kWh·m-2 per year
There was only a small number of schools in recent years of submissions, but two of the three with good data met the LETI EUI.
Other sectors
- LETI target: n/a currently
- RIBA target: n/a currently
From the awards submission data, higher education is probably a sector ‘ready’ for EUI targets, with much data available and several exemplar projects.
There are also many useful examples of office retrofits and energy savings, from operations and maintenance measures through to plant replacement and full façade upgrades, which can support an ambitious energy-use trajectory for existing office stock.
What the review says about data
Despite these findings, the review was limited by the quality or completeness of data, particularly in the early years. Quality of data has improved markedly in the past two years, and many more projects have gone through an overall post-occupancy evaluation exercise including gathering of user feedback.
Typical issues with the data collected included no indication of whether internal floor area is net or gross, unclear language, and inconsistent energy units quoted. (See panel ‘Typical issues with data’.)
Analysis of office entries to CIBSE awards
Energy use across the office award entries covers the whole range of the CIBSE office benchmark distribution curve, from very high down to exemplar low-energy use.
Densities ranged from around 8.5 to 14m2 per occupant, with no strong link to energy-use intensity (at least, as seen from the data available).
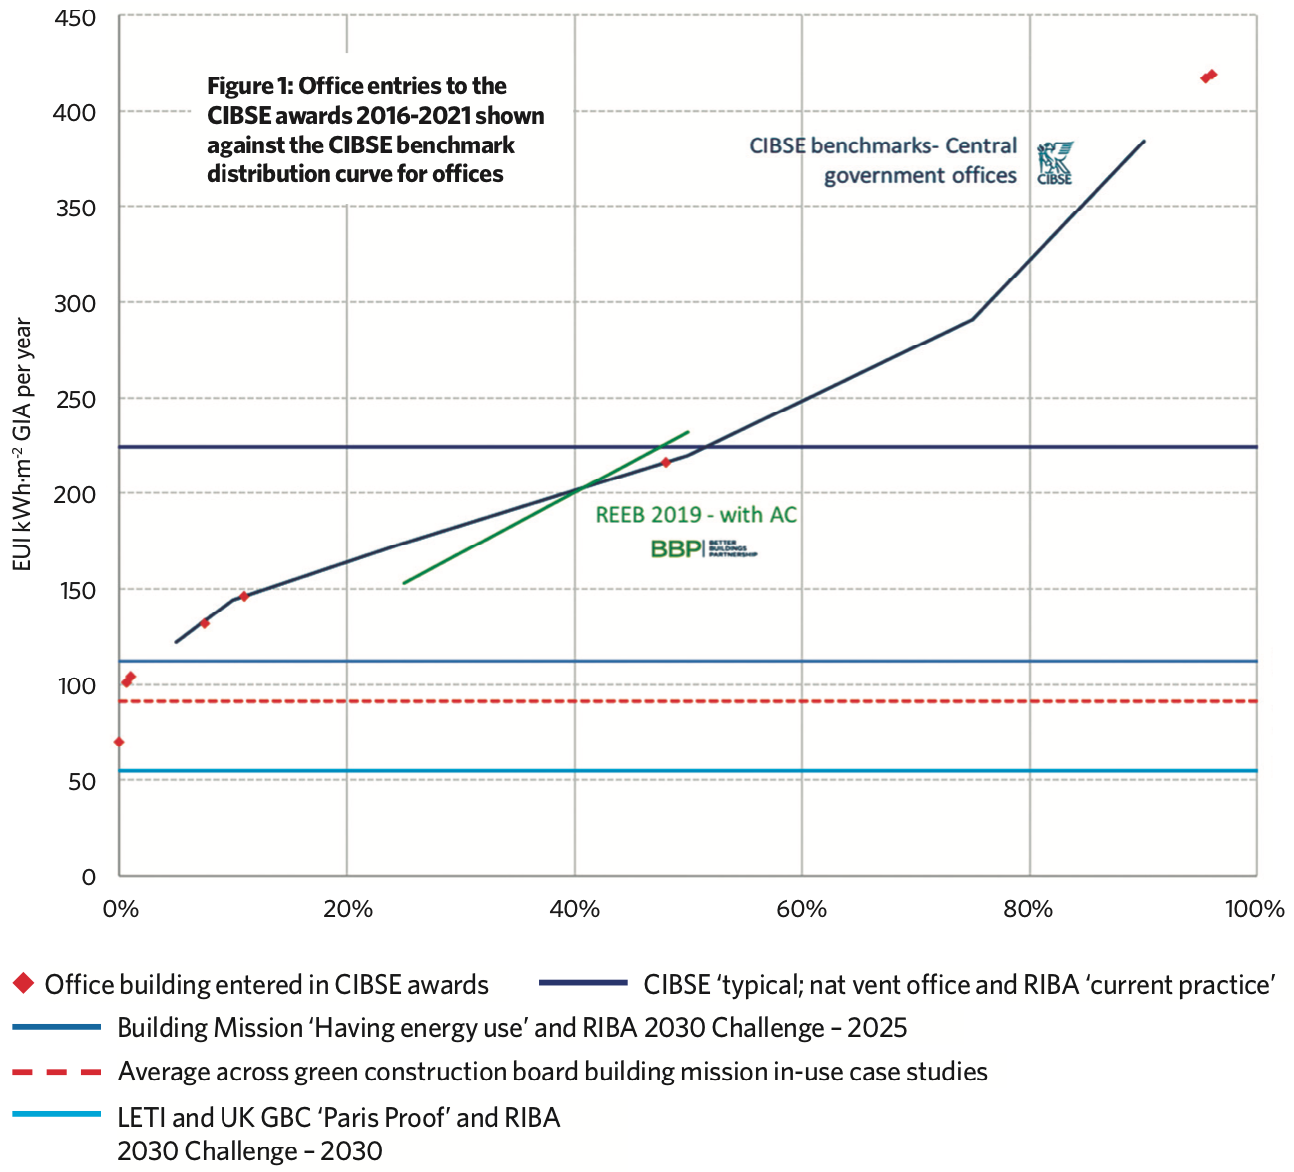
The ‘central government office’ benchmark sub-category has been used as probably the most relevant category to compare large, relatively dense commercial offices. This is supported by the fact that the Better Buildings Partnership REEB benchmarks, also included on the figure and typically covering commercial stock, show reasonably good alignment with the CIBSE curve.
Proposed changes to entry form
CIBSE is proposing a change to the award submission forms, with a separate data entry form for quantitative data on energy performance, alongside the qualitative form. This should have a number of benefits including more clarity on the essential information needed and in quicker data entry, and a clearer and fairer basis for judges to assess the respective performance of entries.
We believe the awards submissions will have more value to industry, as the data will be ready to be processed by CIBSE’s partner UCL to contribute to the benchmark database (subject to agreement from entrants).
Project team members will also have the option to be showcased on the benchmark curves, adding profile to their achievements.
Hopefully in the near future, there will be a streamlined co-ordinated process with other awards, in particular RIBA’s with whom CIBSE has been working for a few years to align criteria and share data. The aim is for in-use energy data entered for the RIBA awards also contributing to the CIBSE database.
We have drafted new data-collection forms for homes and non-domestic projects. The aim is to balance the need for clarity and useful information, while addressing the common issues mentioned above. We realise the very fact of having monitored energy use is an achievement, so the new form recognises this, highlighting the essential asks while offering options for more granular information.
The deadline to comment on the draft awards data collection form is May 6.4 To contribute to other industry efforts on building performance see panel ‘How to support building performance’.
Typical issues with data
- Floor area provided without stating whether it is gross internal area or net internal area, or sometimes not declared at all, which prevents good benchmarking and evaluation of performance
- Buildings served by district heating without indication of whether generation and distribution losses are accounted for in the declared ‘heating energy’ (a very ambiguous term), or with only space heating demand declared, which prevents an evaluation of actual overall energy use
- Unclear language. For example, ‘heat demand’ or ‘heat consumption’ used interchangeably, sometimes to mean demand and other times to mean energy use to meet that demand
- Only thermal or electrical energy use reported, not both
- Energy performance reported in terms of carbon emissions or primary energy, without conversion factors, or as a total without fuel breakdown
- For buildings with onsite PVs, lack of clarity on whether the PV output used by the building (rather than exported) is included in the declared ‘building’s energy use’, or not. In some cases, because of the size of PV systems, this could significantly change the assessment of the building’s energy performance. Similar issues were found with other onsite systems such as CHP and solar thermal panels.
References:
1 TM61-64 suite on Operational performance, 2020
2 RIBA Plan for Use guide, 2021
3 CIBSE Energy Benchmarking tool (beta version)
4 CIBSE awards – New data collection form for consultation
5 RIBA 2030 Climate Challenge,
More resources:
Energy, People, Buildings by J. Kimpian, H. Hartman and S. Pelsmakers
Housing Fit for Purpose, F. Stevenson, 2019 bit.ly/CJMay21LG2
Wood knowledge Wales Building Performance Evaluation Guide and toolkit for housing, 2021