
A carbon atom forms four bonds with neighbouring oxygen to form CO2 molecules, as shown in Figure 1. With each carbon-oxygen bond in CO2 consisting of a double bond, with two pairs of shared electrons, CO2 is very stable. It exists as a gas at standard atmospheric pressure and temperature, as it has a very low triple point of -57°C at a pressure of 5.2bar (where solid, liquid and vapour phases of a particular substance coexist). ‘Dry ice’ – solidified CO2 at below -78.5°C – readily sublimes from a solid to a gas when exposed to standard pressure and temperature. At standard pressure and temperature, it is a colourless, odourless and non-flammable gas that accumulates near the ground (CO2 is 60% heavier than air). Carbon dioxide is often misunderstood as being toxic because it is frequently associated with asphyxiation and even loss of life. CO2 can be toxic at extremely high concentrations and cause asphyxiation; however, such issues are more likely to happen because enclosed environments are vulnerable to CO2 accumulation that displaces the oxygen from the area, so causing hypoxia (low oxygen levels in body tissues). When present at relatively high concentrations – typically quoted in references related to building occupants as being above 10,000ppm – it is commonly thought to cause drowsiness.
Atmospheric CO2
CO2 is released from the Earth’s core through openings such as springs and volcanoes, and produced from acidic water on carbonated material such as limestone. Naturally occurring CO2 emissions – through respiration, fermentation and plant decay – are roughly balanced by the photosynthesis in plants (which also produces oxygen – see Equation 1) and absorption at the surface of the world’s water masses.
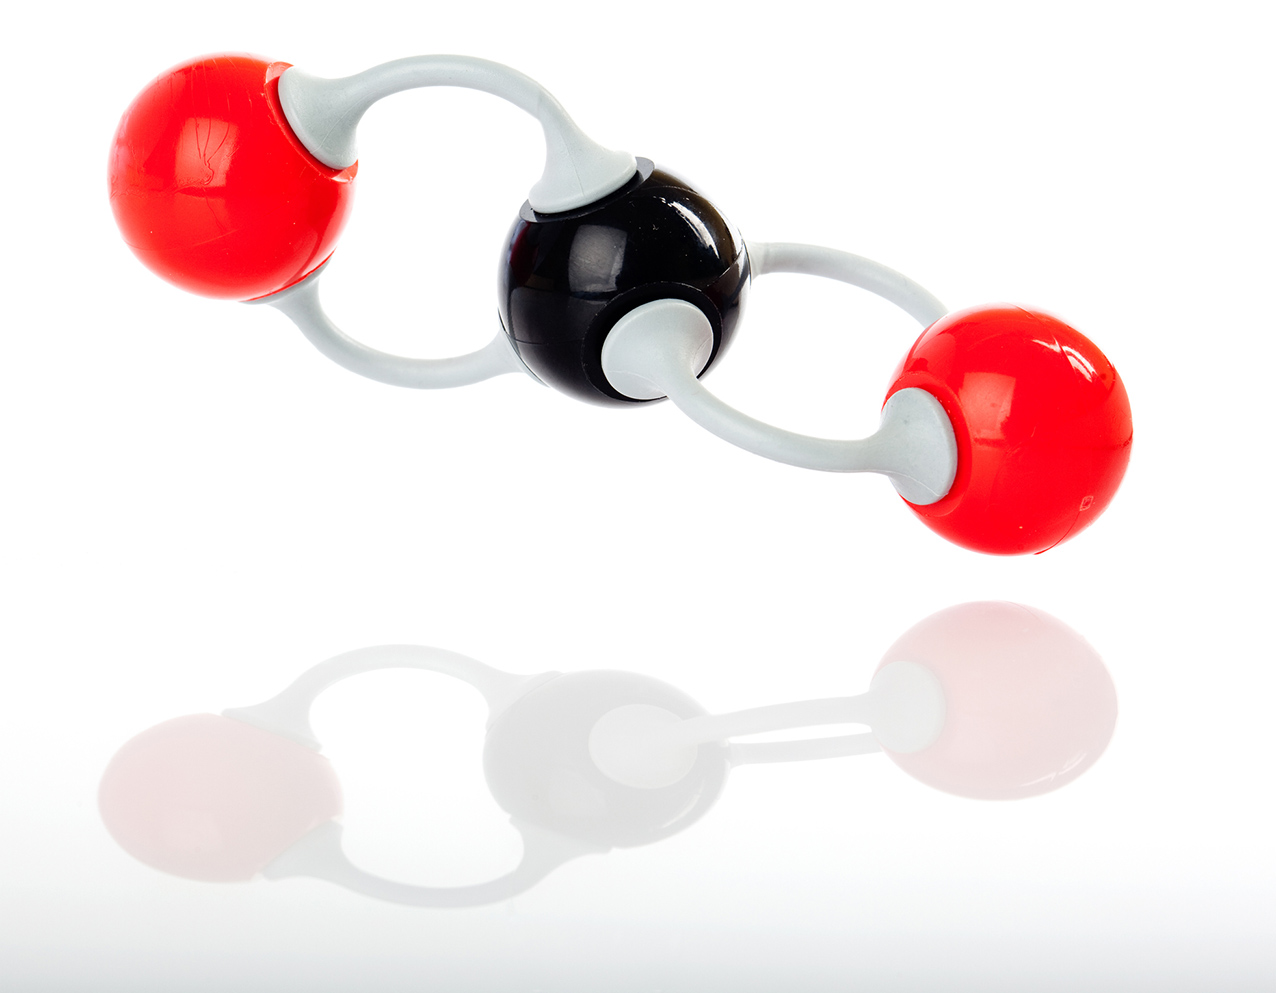
Figure 1: The carbon dioxide molecule
Atmospheric CO2 is thought to have risen by about 45% since the start of the Industrial Revolution. The current atmospheric CO2 level1 is reaching beyond 410ppm (Figure 2) on an apparently steadily rising trajectory.
Elevated atmospheric CO2 has been reported as increasing the rate of plant growth, but also2 adversely affecting the nutritional value of crops, as it reduces the ability of plants to convert nitrate into protein. Recent research3 has indicated that, when coupled with the predicted higher ambient temperatures, the nutritional value of the plant will be maintained.
6 CO2 + 6 H2O + light → C6 H12 O6 + 6 O2
carbon dioxide + water + light → sugars + oxygen
Equation 1: Photosynthesis converting CO2 to plant growth and oxygen
And, of course, the key concern of rising atmospheric CO2 – and the many other more significant gases – is its impact on the global climate.
CO2 is produced by the combustion of fossil fuels, such as coal, oil or natural gas, as well as ‘renewables’, such as wood, biomass and biogas. Coal is the most CO2-intensive fossil fuel, with approximately twice4 the equivalent emissions per kWh of natural gas when it is burned. The combustion of wood emits a similar amount of CO2 as coal.
The term ‘CO2 equivalent’ – or CO2e – gives an interpretation of the amount of CO2 that would have the equivalent ‘global warming’ impact (typically over 100 years) for a particular greenhouse gas. The principal other gases noted in the recent Department for Business, Energy and Industrial Strategy (BEIS) report5 for UK emissions are methane, nitrous oxide and hydrofluorocarbons (HFCs). However, for the residential/business and related energy supply that may be considered as being most influenced by the activities of the building services sector, CO2 emissions provide by far the greatest contribution. The estimated current CO2 emissions for the UK are broken down by sector in Figure 3.
CO2 as a contemporary refrigerant
Despite its notoriety as the measure of global warming impact, CO2 is considered as a low global-warming potential and cheap refrigerant (R744). With the Kigali amendment to the Montreal Protocol (to cut the production and consumption of HFCs) and the European F-Gas Regulations, there has been renewed interest in the use of CO2 as a refrigerant, as it has a global-warming potential of 1.
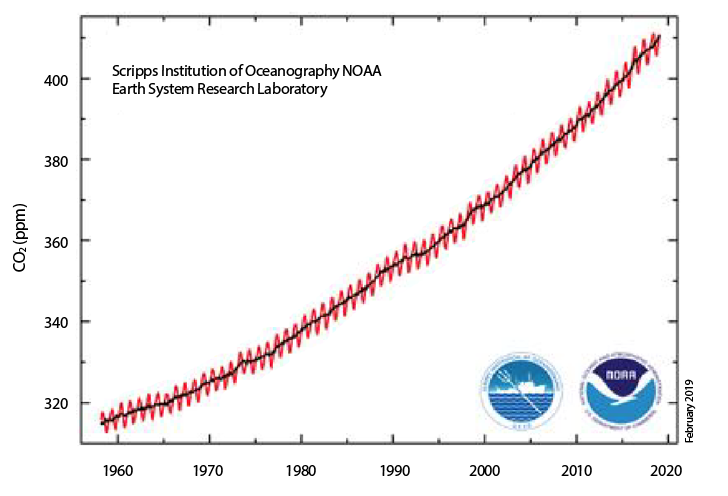
Figure 2: Atmospheric CO2 measured at the Mauna Loa Observatory in Hawaii
The ‘critical point’ for CO2 – at which the temperature and pressure are such that it is in a state of equilibrium between solid, liquid and vapour – occurs at 31°C, much lower than other common refrigerants (for example, the critical point for R134a is at 101.1°C). Above the critical point, the CO2 is a supercritical fluid (considered a gas) and in the CO2 ‘transcritical’ refrigeration cycle, gas cooling takes place instead of the more standard condensation process. Such CO2 systems operate at much higher pressures than commonly used refrigerants in building services applications – the CIBSE Journal CPD from December 2012 offers some further explanation. In recent years, CO2 has increasingly been applied in smaller-scale – as well as the more traditional, larger – commercial refrigeration and heat-pump applications.
CO2 in internal environments
As summarised in CIBSE KS17,6 the CO2 emitted by occupants and/or appliances can give an indication of the ventilation rate in a space. In a sedentary occupied zone, a concentration of 800 to 1,000ppm typically represents a ventilation rate of about 10L·s–1 per person.
CIBSE Guide A7 notes that, as a general rule, the fresh air supply rate should not fall below between 5L·s–1 and 8L·s–1 per occupant, but this will depend on various other factors, including floor area per occupant, processes carried out, equipment used, and whether the work is strenuous. As a rule of thumb, 8L·s–1 fresh air is equivalent to an elevation of 600ppm of CO2 that, when added to the normal outdoor CO2, gives an internal CO2 concentration of approximately 1,000ppm; 5L·s–1 would be equivalent to 1,350ppm internally. However, CIBSE recommends higher values of 10L·s–1 for comfort – which includes consideration of other aspects of IAQ, such as other emissions from occupants known as ‘bioeffluents’. The UK statutory average exposure limit over an eight-hour reference period is a CO2 concentration of 5,000ppm in working conditions, with a 15-minute short-term exposure limit of 15,000ppm.8
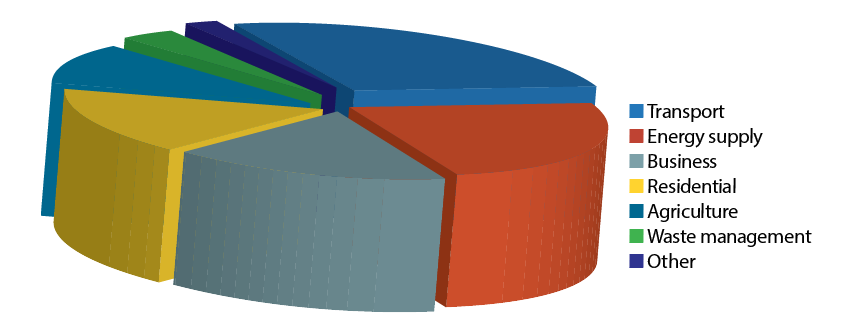
Figure 3: CO2 production in UK 20175
CO2 concentration in indoor environments has long been used as an indicator of ventilation requirements and as a proxy for indoor air quality. The study9 undertaken by Allen, published in 2016, cited the increasingly airtight and energy efficient buildings as key in the increase in levels of internal CO2 and volatile organic compounds (VOCs). Referring to US homes, he noted that infiltration rates had typically reduced from a ‘traditional’ house with one air change per hour to 0.1-0.2 air changes per hour for modern homes. This decrease in the (normally) diluting ventilating action of the outdoor air can lead to increased concentration of CO2 and indoor pollutants that contribute to the resulting challenges of ‘sick building syndrome’.
In an example of the many UK investigations carried out in recent years, the work10 undertaken by Chatzidiakou contributes to the evidence that airtightness in buildings is clearly associated with the internal CO2 concentration. Two similar occupied Victorian school buildings were monitored in 2011. The defining difference between the buildings was that the one featuring recently installed, well-fitting windows had approximately half the infiltration rate of the other, which had older ‘heritage’ windows. The measured internal CO2 concentrations, as shown in Figure 4, appear to reflect the influence of the building airtightness on the measured levels.
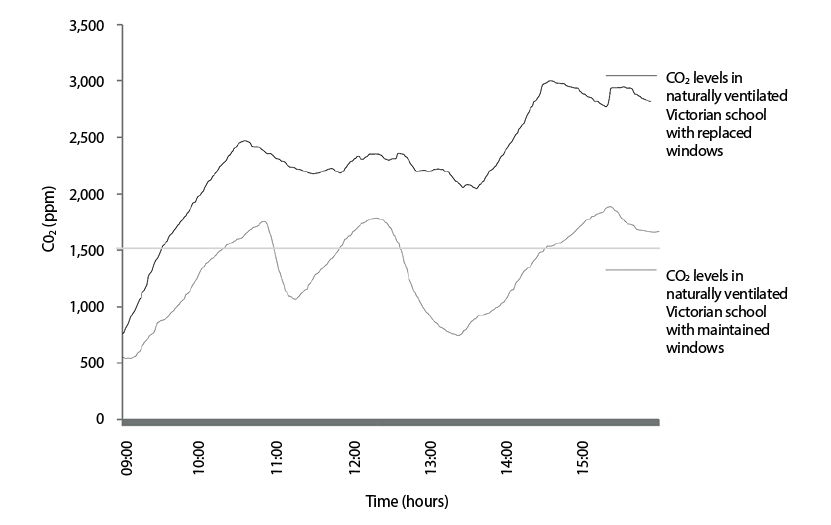
Figure 4: CO2 concentrations during a typical day in two similar occupied Victorian schools
Many studies have attempted to determine the impact of IAQ on building occupants. Recently, Allen’s experimental work9 in a test that ran over six days considered the impact of the indoor environment on higher-order cognitive function – a driver of real-world productivity – in office workers exposed for the whole working day. The study included varying levels of VOCs and CO2. Compared with a low-CO2 environment of 550ppm, cognitive function scores were 15% lower for the moderate CO2 day at approximately 945ppm, and 50% lower on the day with CO2 concentrations around 1,400ppm. The paper acknowledges the traditional use of CO2 as a proxy for IAQ. However, it notes that ‘this conventional thinking is being challenged as the evidence mounts for CO2 as a direct pollutant, not just a marker for other pollutants’, and that the statistically significant reduction in cognitive function measured in this work were at CO2 concentrations that are commonly experienced in indoor spaces.
An extensive review11 of numerous older studies by the US National Research Council indicates that, specifically in relation to the needs of submariners, the long-term limit values for CO2 concentration should be 8,000ppm, with maximum 24-hour values at 25,000ppm. This is, apparently, significantly higher than those values recommended in many studies relating to the built environment.
In a recent interview,12 Pawel Wargocki, of the Technical University of Denmark – an experienced researcher in indoor environmental quality – spoke of his initial surprise at a study in which humans were exposed to 1,000ppm CO2, which was then increased to 5,000ppm, where there were no observable effects on their performance or their subjective responses. However, when the CO2 exposure was combined with bioeffluents, this caused responses that were particularly strong at 3,000ppm. He notes that further work is needed to examine this in detail, but considers that CO2 is merely an index (or proxy) for IAQ.
Human CO2 generation
CO2 is a convenient marker in internal spaces to determine the number of occupants, particularly for use with demand-controlled ventilation systems. In a recent paper,13 Persily reported new methods of estimating CO2 generation rates from people, based on concepts from the fields of human metabolism and exercise physiology, as well as more recent data used in ventilation and IAQ. This new approach characterises body size using body mass rather than surface area, as is used in the current methods that underpin the CIBSE and ASHRAE estimations of human CO2 emissions. Body mass is easily measured and data on body mass distributions are readily available. The approach also explicitly accounts for the sex and age of the individuals being considered, which is not the case with currently employed methods. The new method was compared with laboratory-measured CO2 generation and was found to overestimate by 2% for male subjects and 8% for females. In similar tests, the existing methods were found to overestimate by 20% for males and 33% for females. The paper notes that there is very little published data on measured CO2 generation rates from people and that additional data will be helpful in assessing the new estimation method. The new method is explicitly applicable to groups of people, and not for single individuals.
CO2 measurement in buildings
To enable CO2 control in a building – whether it is considered a direct pollutant or a proxy – requires appropriate measurement. Typically, non-dispersive infrared (NDIR) techniques are employed that make use of selective light absorption of CO2 (a wavelength of 4.26μm is commonly14 used). The NDIR devices have long-term stability, reasonable accuracy (for building services applications) and relatively low power consumption, while also being relatively low cost; sensors are currently available at less than £20. However, the increasing demand for internal spaces that are comfortable, healthy and productive, as well as being environmentally and financially responsible, is prompting the research and development of new distributed, wireless-connected sensors, to allow CO2 monitoring that is simpler to integrate into building systems. An example is a current US$1.5m project15 at Purdue University, which is aiming to develop a new occupancy sensor that has the explicit purpose of saving a substantial part of energy consumption in buildings. This combines a sensor that will detect the presence of CO2 then switch on another, newly developed sensor that will perform precise measurements to determine how many people are in the room; this method is designed to save operational power. The sensor will be slightly larger than a postage stamp, cost less than £0.50 per m2 of building space, and last longer than three years. This is an example of micro-electromechanical systems that contain micro-scale mechanical components employing plates coated with a film that absorbs CO2, changing their vibration frequency.
© Tim Dwyer, 2019.
References:
- www.esrl.noaa.gov/gmd/ccgg/trends/full.html – accessed 6 February 2019.
- Bloom, A et al, Nitrate assimilation is inhibited by elevated CO2 in field-grown wheat, Nature Climate Change, 2014.
- www.ars.usda.gov/research/publications/publication/?seqNo115=353199 – accessed 10 February 2019.
- Carbon footprint of heat generation, Houses of Parliament PostNote, Number 523, May 2016.
- 2017 UK greenhouse gas emissions: final figures – statistical release, UK BEIS, 2019.
- Clancy, E, KS17 – Indoor air quality and ventilation, CIBSE.
- CIBSE Guide A, CIBSE, 2015.
- EH40/2005 Workplace exposure limits, UK HSE, 3rd edition, 2018.
- Allen, JG et al, Associations of cognitive function scores with carbon dioxide, ventilation, and volatile organic compound exposures in office workers: a controlled exposure study of green and conventional office environments, Environmental Health Perspectives.
- Chatzidiakou, E et al, Is CO2 a good proxy for indoor air quality in school classrooms? CIBSE Technical Symposium, April 2013.
- Emergency and continuous exposure guidance levels for selected submarine contaminants: Volume 1, The National Academies Press, Chapter 3, 2017.
- www.iaqradio.com/pawel-wargocki-phd-technical-university-of-denmark-is-co2-a-pollutant-or-merely-an-index-for-iaq/ – accessed 7 February 2019.
- Persily, A, Carbon dioxide generation rates for building occupants, Indoor Air, 2017 Sep; 27(5): 868–879.
- Gibson, D et al, A novel solid state non-dispersive infrared CO2 gas sensor compatible with wireless and portable deployment, Sensors (Basel). 2013 Jun; 13(6): 7079–7103.
- www.purdue.edu/newsroom/releases/2018/Q1/purdue-developing-energy-saving-sensor-in-doe-project.html – accessed 9 February 2019.