![]()
As discussed at length in CIBSE AM111 Building performance modelling, when setting up a modelling capability, the choice of software is important. The software selected and appropriate training of staff require significant resource, so the choice of simulation tools will be a strategic decision.
Factors influencing the decision include: the software pedigree; validation; integration with other software; computer requirement; user-friendliness; training required; support; and so on. CIBSE AM11 provides a checklist to assist such decision-making, including guidance on the type of software that may be appropriate, as in Table 1.
‘Steady state’ calculations are typically carried out for ‘rule of thumb’ checking or to evaluate early-stage design parameters operating on a typical ‘summer day’ or ‘winter day’. These may be undertaken with spreadsheet tools or simple load-calculation software tools and analytical models (such as the CIBSE Admittance Method2). Such methods are limited by the assumed simplifications of the internal and external parameters, as well as their inability to dependably consider antecedent operating periods.
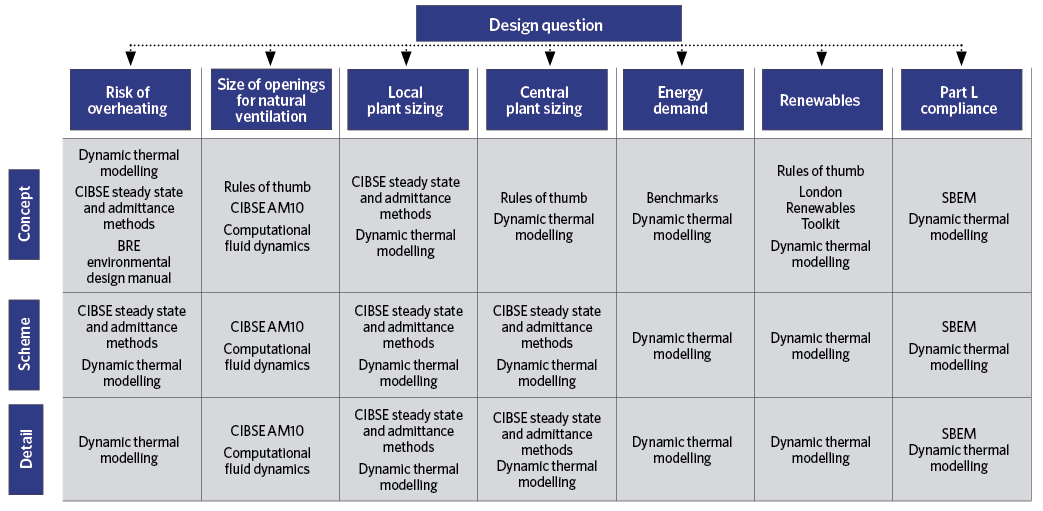
Table 1: Examples of design questions and suggested type of software to apply at various design stages (Source: CIBSE AM11)
In contrast, by carrying out a full dynamic thermal simulation, a user is able to model a whole year (and beyond) by employing data from a site-specific weather file across an unbroken period of time – which could potentially span years of simulation – broken into step lengths of minutes.
Basic weather data files are available for many areas in the world3, while more detailed CIBSE weather files4 are available for 14 UK locations, based on weather data obtained by the UK’s Meteorological Office. Each CIBSE weather file integrates data measured over a 30-year period, between 1984 and 2013, to provide a reliable representation for each location.
CIBSE has also published a series of predicted future weather files for 2020, 2050 and 2080. These have been based on climate-change projections and can allow designers to carry out simulations using the predicted future weather scenarios.
Practical considerations in systems assessment
As highlighted in AM11, it is important that the user appreciates the models are a simplified – and possibly idealised – view of the real world, regardless of apparent complexity and the inferred precision in the output data and graphics. The quality and level of detail of the input data – including any assumptions – are fundamental to the value of the output.
Wherever there is uncertainty in the input values, it is prudent to undertake some sensitivity analysis on the output by adjusting the input range to account for the possible input variance.
So, for example, occupants are unlikely to operate a building exactly as assumed in the model and, despite employing appropriately sourced weather data, the external conditions assumed for energy modelling will not represent a real year of operation. Also, because of the differences in employed methods, outputs from different models are unlikely to completely coincide.
Throughout the non-heating season, adaptive thermal comfort considerations mean that the acceptable temperature limits vary, based upon the external air temperature.
The CIBSE weather file can supply the variable adaptive temperature limit, so by undertaking dynamic thermal simulation, a user is able to analyse the performance of their building – or the sizing of the ventilation and cooling systems – against the variable adaptive temperature limit, as illustrated in the example model output in Figure 1.
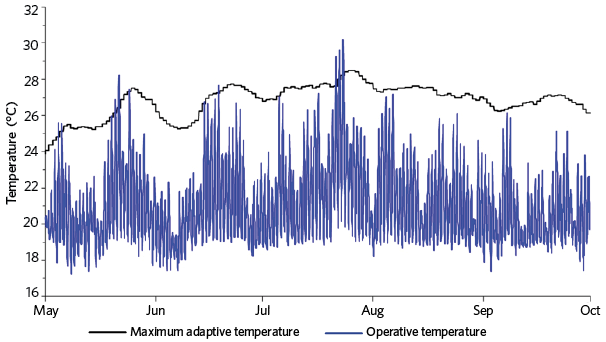
Figure 1: Example of modelled operative temperature and recommended maximum adaptive temperature, as derived from the CIBSE weather data (Source: Monodraught)
Although a ventilation system is more likely to be designed to operate during occupied periods of the day, the unoccupied periods can impact significantly on the room conditions, and this can be readily taken into account with dynamic thermal simulation.
Examples of where dynamic simulation can give essential insight could be perimeter rooms with a large amount of external glazing, or university IT rooms where computers may be left on 24 hours a day. Normally, with the use of summer night-time cooling, the ventilation system would remove any vitiated air to ensure that the room is ready for occupation at the start of the following day.
However, where a large amount of IT equipment is left on overnight – and particularly during periods when external air temperature remains in the mid-20°Cs – it may not be possible to fully dissipate the internal heat gains. With the use of a dynamic thermal simulation, it is possible to model the effects of these heat gains during the unoccupied periods.
For example, scenario modelling can be done to determine the influence of varying the accessible thermal mass of the room, or to assess the impact of an urban location on the potential designs to optimise opportunities for night-time cooling. Such simulation may well require the linking of computational fluid dynamics (CFD) software with the thermal simulation tool.
Design complexity
A key advantage with dynamic thermal simulation software is the ability to alter readily the level of granularity that a user can apply to the modelling. Taking occupancy profiles as an example, these are formed by creating daily profiles, which are combined to offer a weekly profile and, in turn, used to determine an annual profile.
At its extreme, it would be possible for a user to create a different varying daily profile for every single day of the year. A practical example that might justify such detail is an assembly hall in a primary school. It is likely that this could be used, for example, for: assemblies of 30 minutes with the whole school; a single class doing PE; lunchtime dining; after-school activities; special school events; or local community events during evenings or at the weekend.
Another common challenge is assessing, effectively, the coincidence of separate peak loads in a model – such as maximum theoretical occupancy, peak period of solar gain, or peak lighting and equipment gains – that may occur simultaneously only occasionally during the year or for short periods of time.
So, instead of just assessing the room based upon a (possibly very rare) worst-case scenario – which could lead to over-engineering of the scheme – dynamic simulation can be used to examine the typical room use and the occasional peak room use, with both being incorporated into one model.
The peak load could then, for example, be applied to the room once a week, once a month, or even for a couple of consecutive days during periods when external conditions are most extreme.
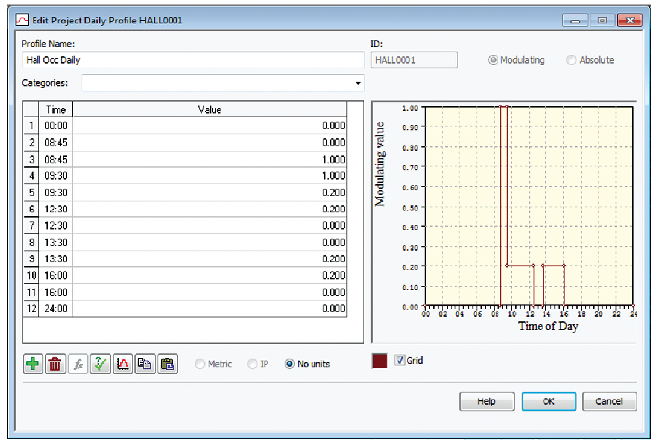
Figure 2: Example of occupancy profiles, as defined in a simulation mode (Source: Monodraught/IES)
Key concerns when assessing the potential performance of natural ventilation systems is how a system will operate to supply fresh air when there is no external wind, and what is likely to happen during a hot summer’s day.
Dynamic simulation, using appropriate detailed weather files, can usefully be applied to examine these worst-case scenarios. With a steady-state calculation, the sizing of the natural ventilation systems is typically based on specific conditions, such as the external and internal temperature difference, a conservative wind speed value and a specific wind direction.
However, when employing a dynamic simulation, it is a common misunderstanding that natural ventilation is simply just applied as a set ventilation rate (for example, 8L·s-1 or 10L·s-1 per person), on the assumption that a natural ventilation system or opening will provide this requirement.
However, as indicated in Figure 3, wind data and the coincidence of particular values will vary widely across the year. Dynamic simulation allows rooms on different aspects of the building to be modelled against the variable wind direction without the constraining assumption that the notional ‘prevailing’ wind will be the dominant design criteria.
This will probably determine that rooms located on different aspects of a building, although identical in form and openings, will experience very different levels of ventilation throughout the year, so giving the opportunity to design and select natural ventilation systems and openings appropriately.
Post-occupancy evaluation
Dynamic thermal modelling can also be applied to as-built simulations, and link in with post-occupancy evaluations. The design-stage model that was simulated against a predicted weather file before the construction of the building can then be simulated against the real-life weather file data.
For example, the Meteorological Office collects data from more than 3,600 locations around the UK, and the data from a desired period of time can be collated into a weather file suitable for running a dynamic simulation.
This type of simulation offers opportunity for post-occupancy commissioning, and generates diagnostic data and improves understanding that can usefully be employed in future designs.
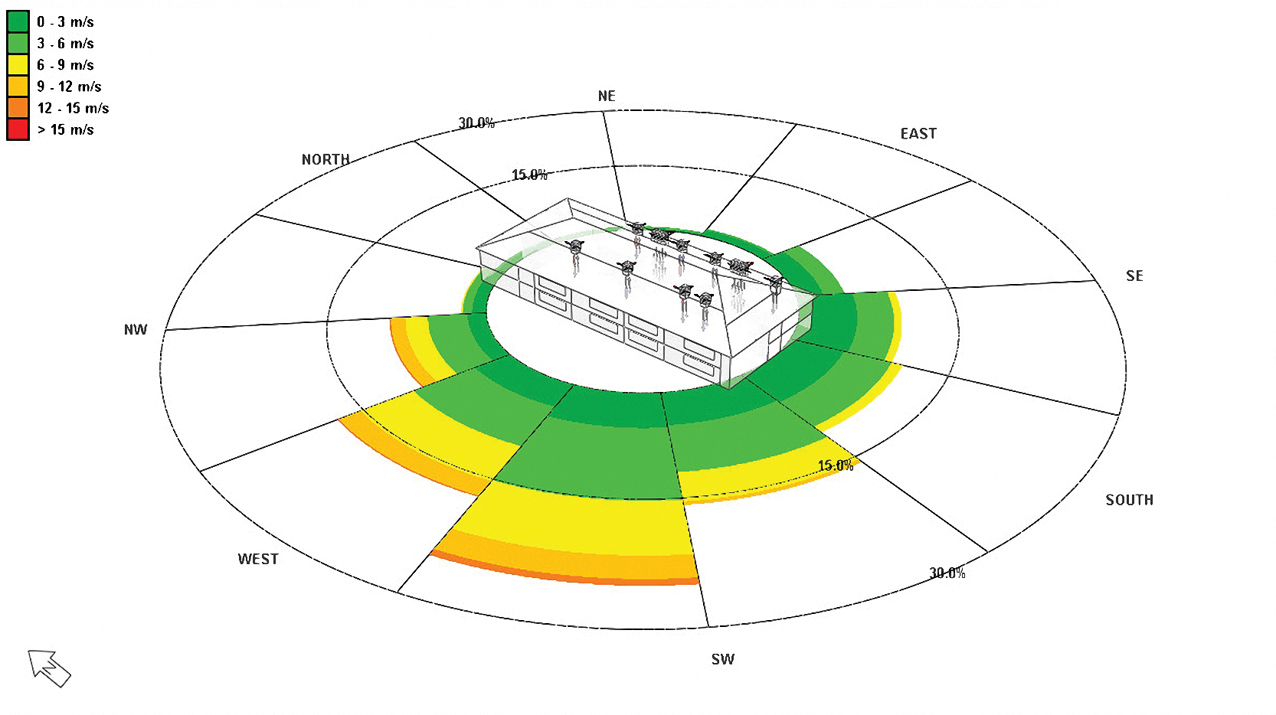
Figure 3: A wind-rose representation indicating the frequency (by the radial length) of wind direction and speed (by colour) for a particular site (Source: Monodraught/IES0)
Both passive and active building ventilation systems are increasingly likely to include integral data logging and recording facilities that also communicate with the building management system.
At its simplest, these can provide critical information for those responsible for maintaining and servicing the equipment to analyse, troubleshoot and improve the installed system performance. But this data can also be used to compare the performance of the design simulation against the recorded building performance data. As with all modelling exercises, there will inevitably be variations between the modelled and real data.
However, should there be a large variation between the results, more advanced analysis and assessment can follow to improve the system design and operation.
Factors that typically cause such differences include: how a room is actually used compared with what was assumed at the design stage; variations in the type of construction materials and fabrication methods; and control issues with the operation of the heating or ventilation systems.
The future of dynamic simulation
Simulation models are developing swiftly to allow even non-expert users to undertake holistic analyses of whole buildings, as well as more extensive simulations of estates and cities.
Data collected from increasingly ubiquitous sensors – including those supplied as part of manufacturers’ equipment – give opportunities to identify periods where buildings or individual systems may not be performing as they have been designed, which, in turn, may affect the adjacent room, space or building.
Aside from identifying and assisting in resolving problems, the ability to integrate real-life performance data into a dynamic simulation can allow designers and manufacturers to develop and improve their systems.
For example, this data could be used to identify periods when ventilation systems may be supplying too much – or too little – airflow, and then dynamic simulation can be undertaken to further optimise the system design.
Although able to provide useful interpretations of real-world building systems, dynamic simulation software is still far from mature.
It will continue to develop with, for example, quantum computing capability and more effective simulation algorithms; improved understanding of the built environment and elemental performance; accumulated feedback from installed equipment and systems; and the increased use of artificial intelligence.
When coupled with the enhanced simulation outputs using augmented and virtual reality techniques, there will be unprecedented opportunities to properly understand – and advance – the effective operation of real building systems.
© Tim Dwyer, 2018.
References
- CIBSE Application Manual, AM11 Building performance modelling, CIBSE 2015.
- CIBSE Guide A, Environmental design, CIBSE 2015.
- https://energyplus.net/weather – accessed 9 June 2018.
- www.cibse.org/weatherdata – accessed 9 June 2018.