Sponsor of this month's CPD
School buildings are often built and operated within tight financial constraints but, at the same time, require high standards of indoor air quality (IAQ) to promote good learning and health. This article will reflect on the application of natural ventilation as a method of maintaining IAQ, and consider the application and control of natural ventilation for school buildings.
As discussed more fully in the December 2016 CPD article Hybrid ventilation for schools, ventilation in buildings can be broadly categorised as natural, mechanical or hybrid ventilation. All three ventilation types have appropriate applications; however, determining whether there is an opportunity for natural ventilation would be the normal starting point for a project.
Natural ventilation in buildings will be driven by the velocity of the wind impinging on the building’s fabric, as well as by the pressure differences developed through air temperature variations, and the resulting ‘buoyancy’ effect.
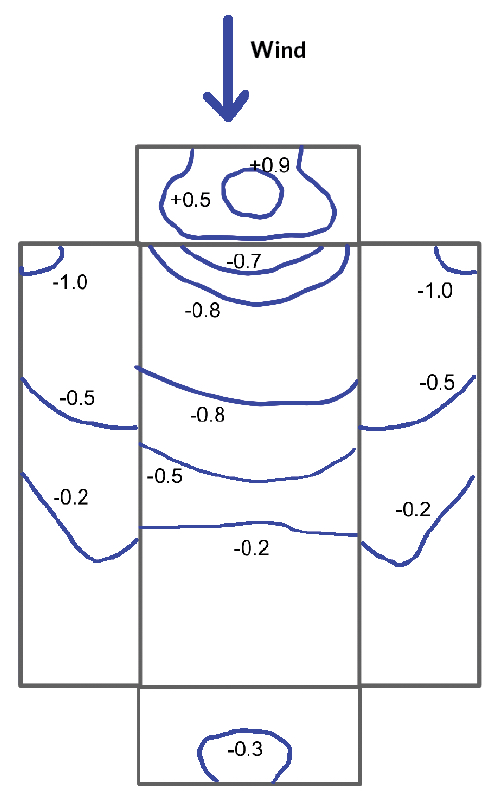
Figure 1: A ‘flattened’ representation of a rectangular building showing example pressure coefficients for a particular wind direction
CIBSE Guide A4 and application manual AM10 provide detailed methods and examples for assessing the practical potential for natural ventilation that are based on networks of airflow paths through openings (including cracks) in the building fabric, and the available driving pressure. The driving wind pressure (Pa) is related to the velocity pressure pv = Cp·(0.5·ρ·v2), where ρ is air density (typically taken as 1.2 kg·m−3) and v is the undisturbed wind velocity measured (in m·s−1) as if there were no buildings or other obstructions at an appropriate height. Cp is the pressure coefficient, and will depend on the shape of the building and the direction of the wind. The value of Cp will vary across the building’s surfaces, as illustrated in the ‘flattened’ rectangular building in Figure 1.
So, for example, for the building represented in Figure 1, the effective pressure being felt in the centre of the short windward wall, for a windspeed of 5 m·s-1, will be 0.9·(0.5 x 1.2 x 52) = 13.5 Pa. Values of Cp are typically determined using wind tunnel tests (as well as computational methods). There are tabulated average face values of Cp for a selection of common building aspect ratios and heights in CIBSE Guide A4. Wind pressure will, of course, be variable and is subject to interference at ground level from obstructions.
For stack ventilation, the pressure difference is caused by the difference in mass between the air in the building and that of the air outdoors. Pressure (Pa) at the base of a column of fluid (such as air) is simply 9.81·ρ·z, where z is the column height (m). By including a relationship that determines the value of air density at a specific temperature, the available pressure for driving ventilation between two openings in a building can be determined. If one opening is at height z2 (m) and the other at z1 (m), with inside air temperature θai (ºC) and outside air temperature θao (ºC), the driving pressure difference is given by
Δp = -3,455 (z2-z1) (1/(θao+273) – 1/(θai+273)) Pa.
So, for example, the available pressure between two windows – one 3m above the other in a room with air temperature 21ºC when outdoor temperature is 1ºC – would be -3455 x 3m x (1/(1ºC+273)- 1/(21ºC+273)) = -2.57 Pa (the minus sign indicating that the flow would, in this case, be from top to bottom).
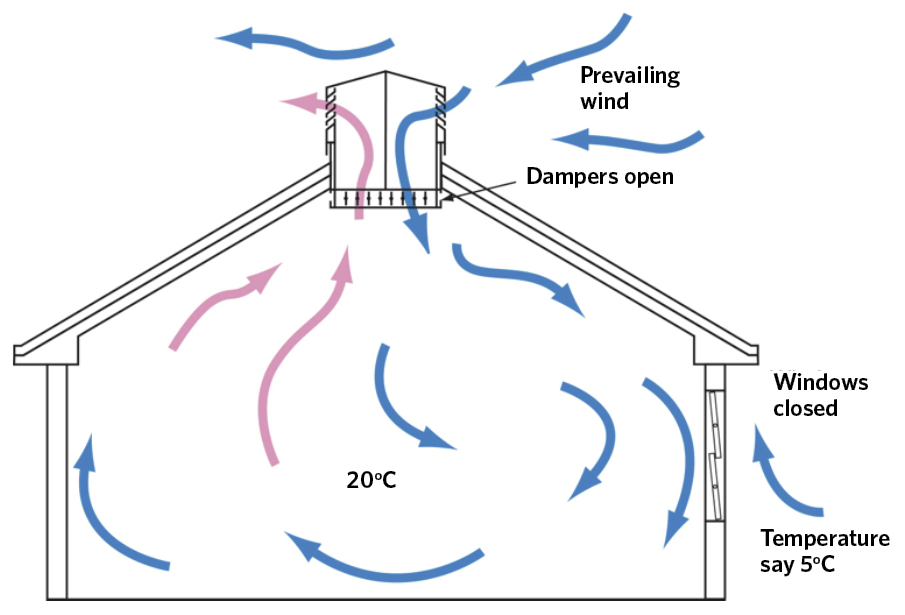
Figure 2: Integrating a ventilation tower to provide top-down natural ventilation (Source: Monodraught)
Both wind and stack will provide a pressure differential that will cause air to flow through openings – by design and fortuitously (fortuitous flow being termed ‘infiltration’ or air leakage). Flow will vary approximately with the square root of pressure difference ñ so a doubling of driving pressure would provide √2 = 1.41 times the natural ventilation.
As shown in the preceding calculations, the available pressure to drive natural ventilation is likely to be relatively small. For comparison, in a mechanical ventilation system a clean panel filter is likely to require a minimum of 40 Pa and a standard louvre will need around 20 Pa to pass a desired airflow.
Applying natural ventilation
The methods by which spaces are naturally ventilated may be split into four groups.
Single-sided ventilation – as discussed by Plesner1, this is a complex mode of ventilation driven by wind pressure, the fluctuations in wind pressure and the stack effect. Typically, windows would provide the openings, and this mode is likely to be effective up to a room depth of approximately twice the room height. For building façades with separate upper and lower openings – as in traditional sliding sash windows – this can be effective for up to a room depth of two and a half-times the room height. For cross ventilation to be successful, a pressure differential is needed between two openings on opposing faces of a room, which would normally mean that both sides have to be open to the outside air (some have an open side into a building atrium or ventilation chimney). If the openings are subsequently closed on one side, the ventilation system will revert to a single-sided system. As the air moves across the space, it will pick up heat and pollutant from the internal environment before it leaves the room. This can provide effective ventilation for a room width of up to four-to-five times the room height. Stack assisted ventilation provides a more reliable opportunity for natural ventilation, as it depends on the temperature ñ and so density ñ differences in air. In simpler applications it may be from a low-level window, or louvre, on one side of the room to a high-level window or louvre on the same side, or on the opposite side of the space. This can provide air flowrates during hot, still days – and work in deeper plan spaces. Systems can include chimneys (possibly solar or waste-heat assisted) that are used to increase the stack effect, and windtowers that use the wind’s velocity to induce airflow using the ‘venturi’ effect. Top-down ventilation (as shown in Figure 2) takes advantage of both wind-driven and buoyancy-driven ventilation. However, it is not completely reliant on either. Stack-driven buoyant air rises within the space and, as it leaves through a purpose-made ventilation tower, is replaced with outdoor air that enters the tower through the positively pressured windward side. The leeward faces of the ventilation tower have a lower pressure that helps to extract the buoyant, stale, warm air from the space below.
Air introduced from high level is typically less likely to carry airborne pollutants, and less prone to noise pollution compared with ground-level sources. These systems can ventilate deep plan areas that do not otherwise have direct access to outdoor air, and are not affected by the depth of the room.
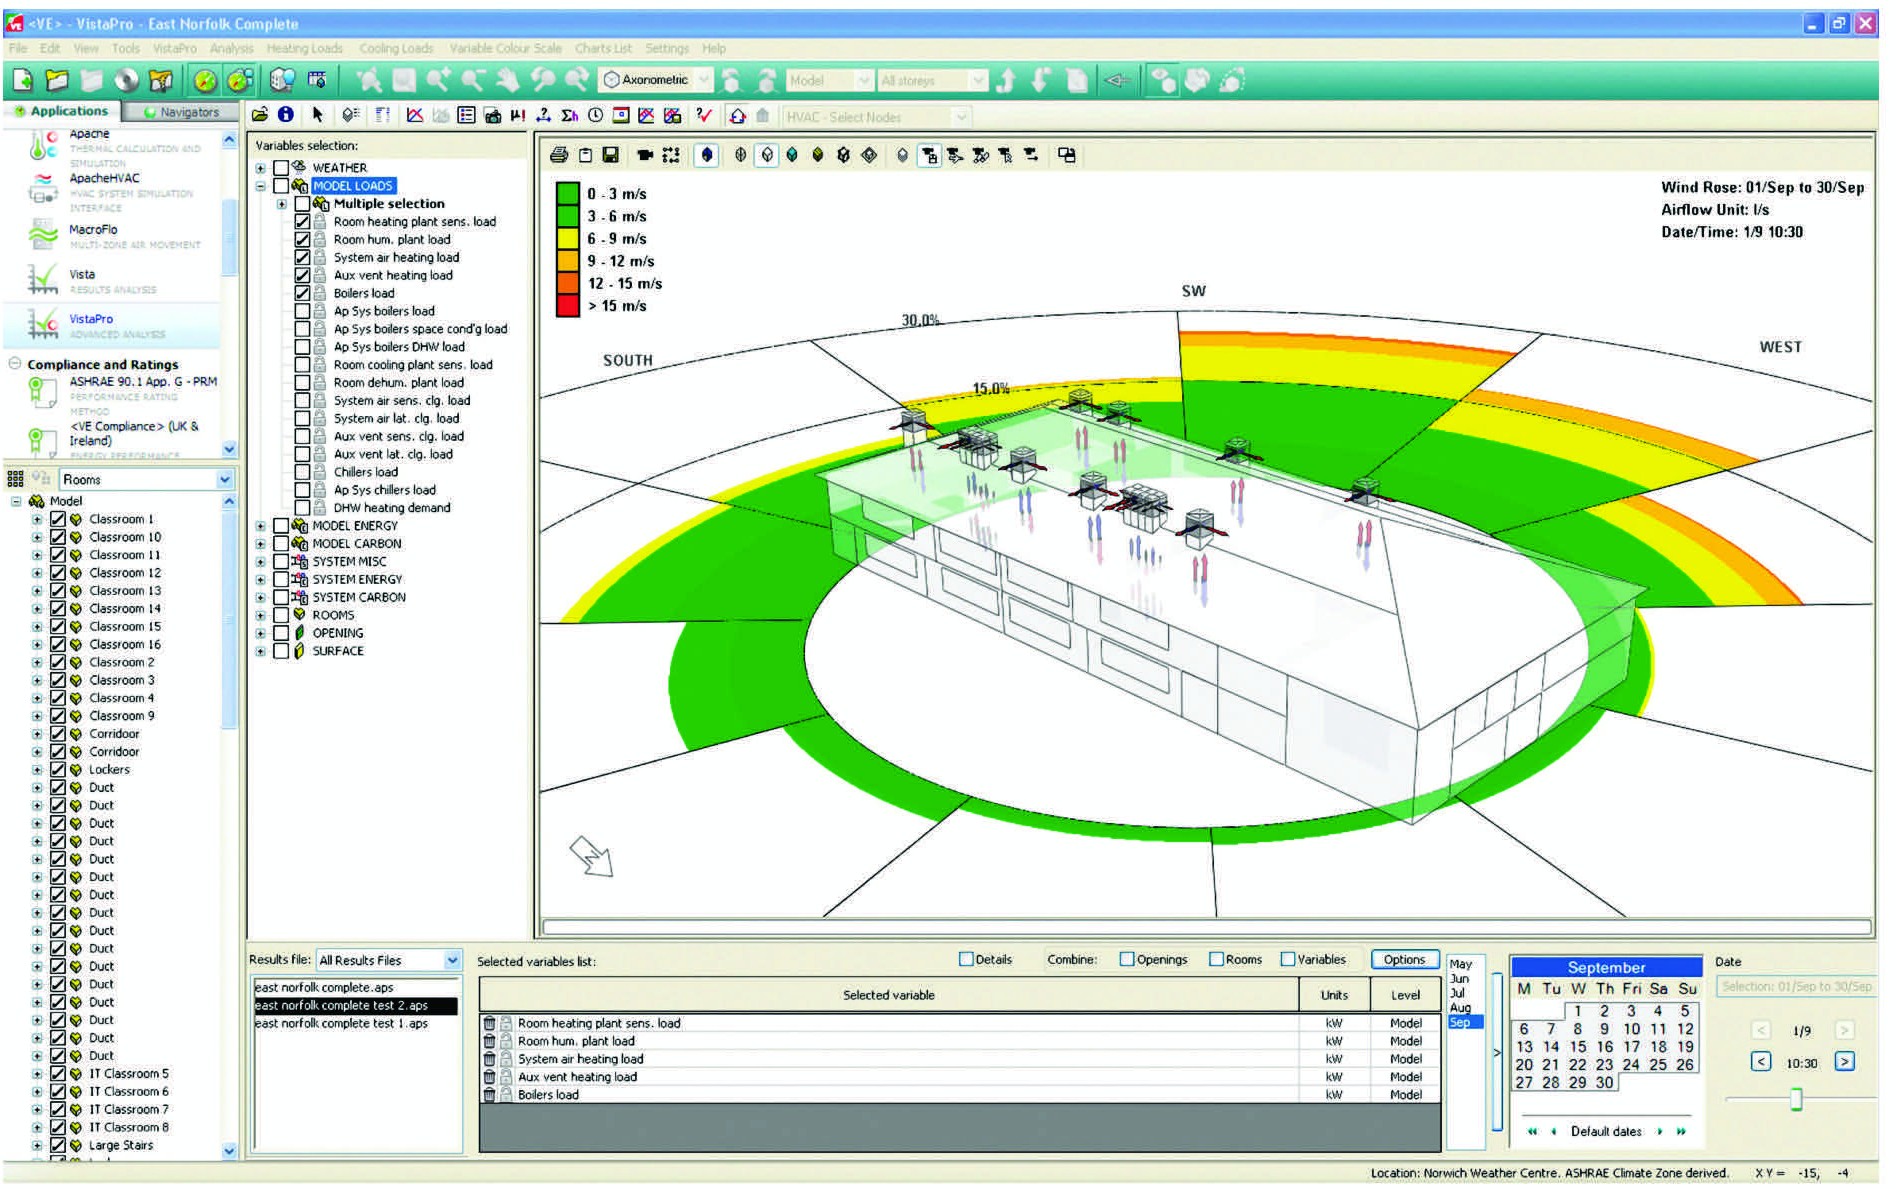
Figure 3: Windtower components that include both geometric and functional parametric information can be ‘dropped in’ to a standard modelling environment (Source: Monodraught/IES)
Whichever method is employed, the ‘ventilation effectiveness’ should be considered. The system will only be successful if the supply air not only removes the pollutants and heat, but also provides fresh (as opposed to stale or already contaminated) air to the occupants. It is this consideration that will affect the practical effective depth of a naturally ventilated space. The complexities of airflow movement within the space and the building itself mean that computational fluid dynamics is often required to evaluate properly the patterns and resulting effectiveness.
Modelling natural ventilation
It is challenging to forecast properly natural ventilation because of the multiple variable parameters, including: wind speed; wind fluctuation; ambient temperatures; opening sizes; internal pathways; and flow characteristics. And, as the wind direction changes, so does the whole pattern of flow paths through the building, as the pressure coefficients alter across the building surfaces. As discussed earlier, the practical driving pressures are likely to be small, and so require particularly careful consideration to determine the flow through appropriately low resistance networks of openings.
There are models (such as Liddament’s simple but effective AIDA algorithm2) that can provide predictions for simple natural ventilation networks. As discussed in the December CIBSE Journal CPD article, there is great opportunity to use the computational fluid dynamics (CFD) and dynamic thermal simulation software to provide a model. However, as reflected in that article, CFD still requires expert input to provide credible output. Manufacturers of natural ventilation systems have joined with simulation software suppliers to produce robust tools that require fewer inputs than normal commercially available simulation tools. This can provide a useful tool for sizing natural ventilation systems, particularly during the early stages of a project, when full details of a building are not always readily available.
Libraries of predefined objects are also increasingly available for dynamic thermal simulation software (as shown in Figure 3) that provide both a geometric representation and functional parameters. These are likely to become more common as building information modelling (BIM) methods further permeate the industry. This allows the assessment of performance to investigate the capabilities of a potential scheme within a standard modelling environment.
Controls for natural ventilation
Ventilation controls may be used to monitor CO2, temperature and humidity. They can typically be linked into the building management system so that they can be integrated into wider building monitoring and control, with the operational data collected and processed for system management. For example, this allows time zoning of the building to accommodate periods of occupancy and times when ‘night cooling’ may take place, and to provide frost protection control. They can be linked in to hybrid systems (see December 2016 CPD article) to maximise opportunities for introducing larger volumes of lower enthalpy outdoor ‘fresh’ air.
The use of accessible linked visual display interfaces can help educate end users about how the systems operate so that they may better maintain a comfortable, productive environment with minimum energy use.
An example of applying a windtower-driven natural ventilation system
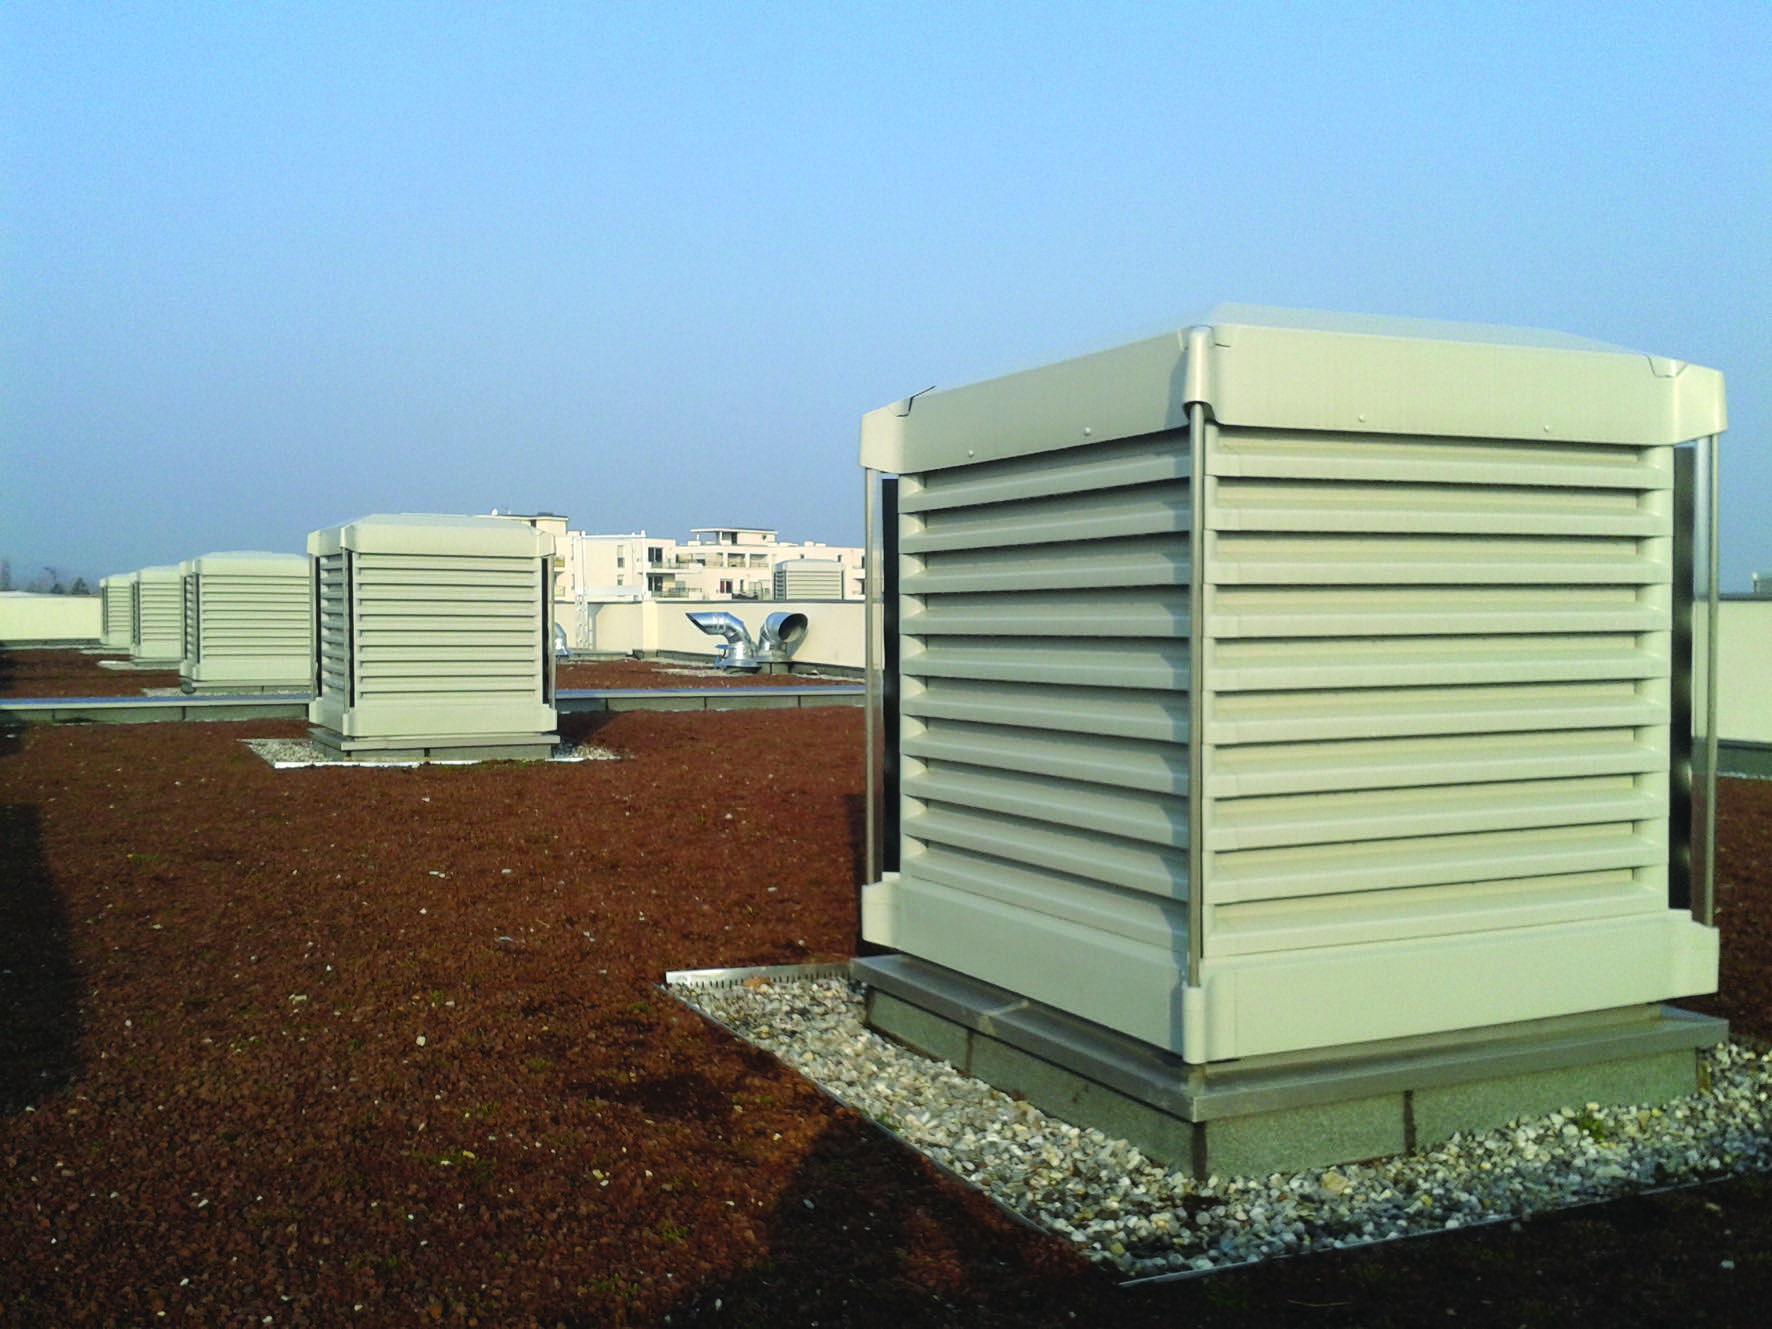
Figure 4: The windtowers pass through the roof of Simone Veil nursery and primary school, near Lyon, France (Source: Monodraught)
A natural ventilation system was used as part of the building system for a French school renovation that subsequently received a Green Building Solutions Award from the Construction 21 Network for Health and Comfort.3 The Simone Veil nursery and primary school wanted control of its year-round energy consumption, and to ensure low carbon emissions, while maintaining high levels of IAQ (and acoustic environment) for the health and comfort of its pupils and teachers. Located close to Lyon, south-east France, the ambient temperature is typically 3 to 4K warmer in summer and 2 to 3K cooler in winter than London.
The building system was designed so that it could maintain appropriate conditions in both summer and winter, and be capable of limiting the maximum temperature to 26ºC without any active cooling system, following three consecutive summer ‘heatwave’ days, and with an occupancy of 30 students per class. The thermally heavyweight, carefully constructed fabric of the two-storey buildings was designed to minimise solar gains. The natural ventilation system consists of external static louvres and internal active louvre arrangements, which vary the opening and free area through the louvre face. The natural ventilation is driven with 16 windtowers above individual classrooms.4 The system monitors CO2 levels to actuate the louvre units, and has successfully provided a minimum ventilation rate of 7 L·s-1 per child during operation. The system provides ‘free-cooling’ and offers night ventilation, while requiring almost no maintenance compared with mechanical ventilation systems. Levels of indoor air quality and measured CO2 levels have readily met design requirements.
New UK guidelines5 on ventilation, thermal comfort and indoor air quality in schools are soon to be published. An appropriately designed and controlled natural ventilation system should be considered as a potential option to meet these requirements as, in many applications, it is possible to maintain IAQ levels while meeting the comfort requirements with low energy consumption.
© Tim Dwyer, 2017
Further reading
For key guidance on natural ventilation CIBSE Applications Manual AM106 and the recently revised CIBSE Guide A Section A42 are both excellent references, featuring practical examples.
References
- Plesner, C. et al, Calculation methods for single-sided natural ventilation – simplified or detailed? CLIMA 2016 – proceedings of the 12th REHVA World Congress, May 2016.
- CIBSE Guide A 2016, Appendix 4.A3
- Kindergarten and primary school group Simone Veil – accessed 30 November 2016.
- Windcatcher X-Air and Suncatcher Classic installed in award-winning French school building – accessed 30 November 2016.
- Guidelines on ventilation, thermal comfort and indoor air quality in schools, Building Bulletin 101 – accessed 30 November 2016.
- Natural ventilation in non-domestic buildings CIBSE Applications Manual AM10, 2005.