![]()
This CPD will consider the factors that may be used to assess and improve the acoustic performance of plastic soil and waste pipes.
In the UK, the sizing and piping arrangement for soil and waste pipes should conform with BS EN 12056-2:2000 Gravity drainage systems inside buildings, as referenced by the building regulations and standards. Waste pipes – typically, nominally 32, 40 or 50mm diameter – carry water discharged from sanitary appliances (such as basins, sinks, showers, baths and urinals) into the main soil pipe, or ‘discharge stack’. The soil pipe (so named after the euphemism ‘night soil’) – typically of outside diameter 110 or 160mm – often combines foul water from WCs with that from other appliances, and passes through the building, eventually to connect with a sewage system. Additionally, the building regulations and standards (including AD Part E1 of the England Building Regulations) make provisions to ensure that the acoustic performance of above-ground soil and waste systems is properly considered.
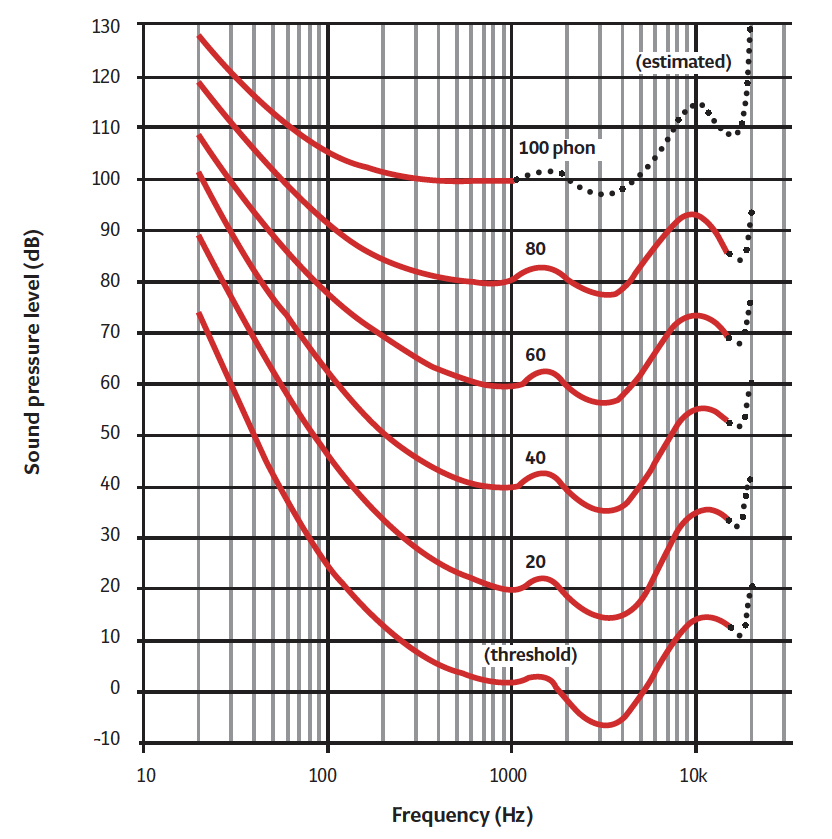
Figure 1: Phon – equal loudness contours (Data source: ISO 226:2003)
As discussed in CIBSE Guide G 2014 Public health and plumbing engineering, the location, intended use and occupancy of the space are all relevant to the acoustic performance. If the space is to be used as, for example, a car park the acoustic treatment is likely to be limited to materials selection. However, for more sensitive areas – for example, offices, study/quiet areas, domestic and hotel applications – more effective treatment will be required, such as using building mass, sound insulation, architectural (appropriately constructed) ducts or pipework that is manufactured and installed to produce less noise. Assessing the potential effect of noise on building occupants often requires the specialist analysis of an acoustics expert. However, building services professionals will benefit from some key knowledge of the parameters that define the acoustic environment, so that they are better able to interpret acoustic data and the performance of services systems.
Acoustic parameters
The actual strength of a particular sound felt by the ear is related to the sound pressure, p (Pa), – this is the amplitude of the sound wave, and to accommodate the range of ambient sound pressure levels, logarithms are typically used to represent the ear’s response to sound. The ‘Bel’ is given by the log (to base 10) of the ratio of two quantities – for example, two comparative sound pressure levels. The ‘deciBel’ is a tenth of a Bel, and provides a more usable scale. The human ear responds to sound intensity I, where I = p2/ρc and ρ is the air density (kg·m-3) and c is the speed of sound (m·s-1).
Since intensity varies with square of sound pressure, the sound pressure level uses a ratio of the square of the sound pressure to provide a usable and relevant metric for sound pressure. So,
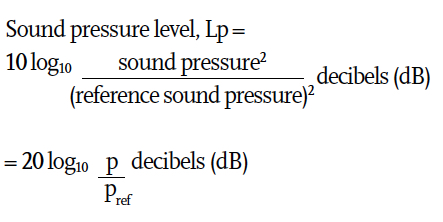
and pref is the pressure at the lower end of human audibility 2 x 10⁻⁵ Pa (or 20 μPa)
So, for example, in the middle of an office, if the sound pressure (at a particular frequency) is 1.2 x 10⁻³ Pa, the sound pressure level, Lp =
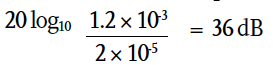
A 3 dB change in sound pressure level is just noticeable, 5 dB clearly noticeable and 10 dB has a perceived volume as being twice (or half) as loud. In an open space, the sound pressure will halve as the distance from the sound source is doubled (since the noise is spreading across an area 4π ·distance2) – the reduction with distance is somewhat less in a room because of its reflecting surface.
The ear does not respond equally to all frequencies. This is reflected in the phon scale, as shown in Figure 1. For example, the 40 phon contour shows values of Lp for other frequencies that are perceived equally loud as 40 dB at 1,000 Hz, so at 100 Hz a sound pressure level of nearly 60 dB will have the same perceived loudness as 40 dB at 1,000 Hz. The curves indicate that generally low (or very high) frequency sounds need to have a greater sound pressure level to be perceived as loud as less extreme frequencies.
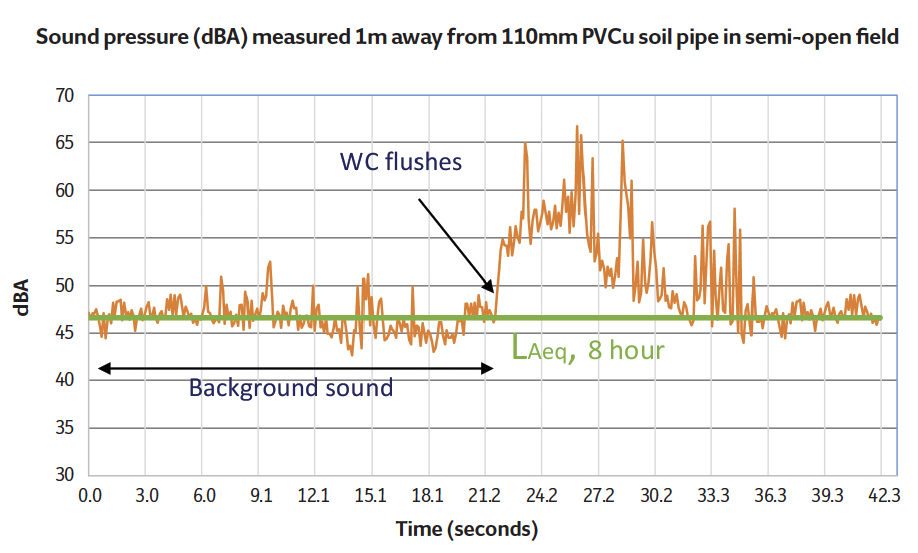
Figure 2: Sound pressure adjacent to example soil pipe when WC flushes. Using time-averaged sound pressure levels will not identify any potentially disturbing sounds from the soil stack
The value of sound pressure level may be frequency ‘weighted’ in terms of the perception of human hearing. There are several different types of weighting that may be applied, but for the relatively low sound intensities experienced within buildings, the weighting network A, dBA, is commonly used. This approximately simulates the 40 phon contour by weighting (biasing) the measurements of the sound pressure level measured across each of the octave bands (that is, with centre frequencies of 62.5 Hz, 125 Hz, 250 Hz, ….16 kHz), or across third-octave bands. Sound level meters will normally produce a direct display in dBA with no need for manual conversion or calculation. Where there is predominantly low frequency noise, dBA may well underestimate the apparent loudness. However, the A weighting is widely used to describe noise levels for building services applications.
There are several other common measures of sound criteria used in buildings, and particularly associated with building services noise. These include noise criterion (NC) and, where a better appreciation of sound ‘quality’ is demanded, room criterion (RC) – these are discussed more fully in CIBSE Guide A 2015 section 1.10.5. These are directly available as outputs on modern sound level meters.
Sound emissions from soil systems are likely to be intermittent, and with lightweight plastic systems the intensities and frequencies can be challenging to moderate, because the flow within the pipe generates noise through impact or turbulence as the flow is varying and disrupted. This may not be obvious when noise surveys are carried out, since the noise will be dependent on the actual use of the sanitary appliances. A simple noise survey will typically apply a time-averaged value of sound pressure to provide an equivalent continuous A-weighted sound pressure level over a particular time period T given2 by
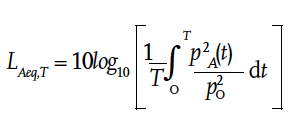
where pA (t) is the instantaneous A-weighted sound pressure level and pO is the reference sound pressure (20 μPa).
Depending on the length of period, T (typically several hours), this will effectively obfuscate any intermittent sounds, since this type of measurement is particularly suited to evaluating the time average sound levels. A continuous measurement – such as that shown in Figure 1 – can create a better tool to identify the intermittency of such sounds.
An office is likely3 to have a LAeq,8hour of between 35 dBA and 45 dBA, while a place suitable for relaxation – including domestic living spaces in peaceful areas – is likely to be between 30 dBA and 35 dBA. Since dBA values are based on logarithmic relationships, two separate sound sound sources (for example, X dBA and Y dBA) cannot simply be added to indicate a total sound pressure level. Two identical value sound pressure levels (for example, 35 dBa + 35 dBA) will give a combined additional value of +3 dBA (that is, 38 dBA). If the difference between the two values is greater than 9 dB, then the overall sound pressure level practically will simply be the higher of the two values. Typically, the noise levels (at source) from water and sanitary appliances and fittings4 lie in the range 45-85 dBA, and so can dominate the acoustic environment in an occupied room.
Noise from soil and waste pipes
The sound from soil and waste pipes can transfer into the occupied space: directly from the surface of the pipe as airborne sound; through the building structure where the pipe is not isolated from the adjacent surfaces (either through pipe supports or by direct interference); or along the pipe to and from a connected appliance. As noted in Wise and Swaffield’s seminal book4, the 25mm depth of water seal required for sanitary purposes (as provided by the waste trap) is also generally adequate to prevent the transfer of noise emanating from the connected appliances.
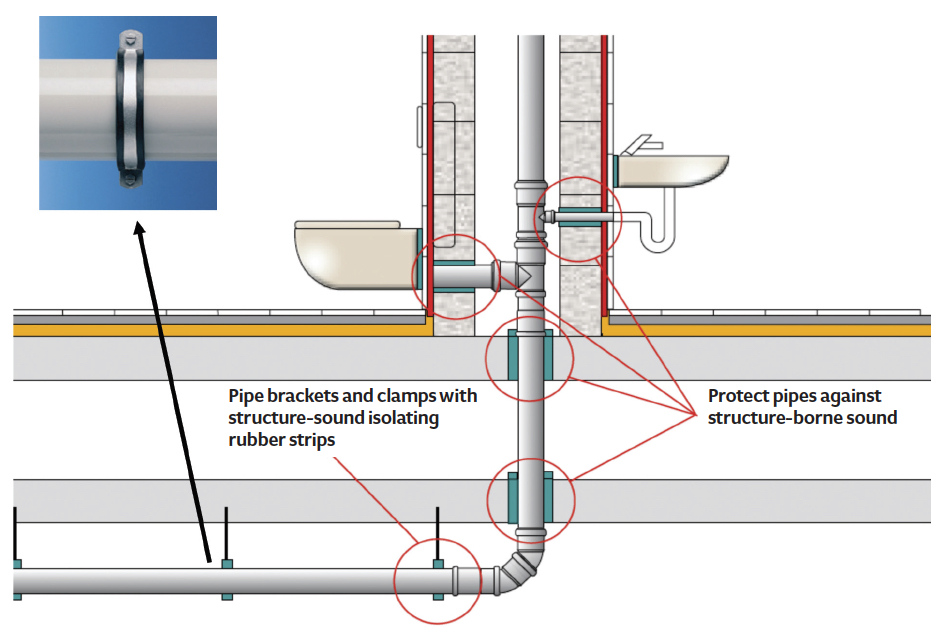
Figure 3: Soil and waste pipe arranged to reduce structure-borne sound (Source: Wavin)
CIBSE Guide G notes that the building construction has a bearing on the measures required. For example, steel-framed buildings transmit sound far more easily than a concrete-framed buildings, and so the designer needs to be particularly diligent in specifying pipework supports with ‘acoustic’ inserts and sleeves to alleviate structure-borne sound. Structure-borne sound can be complex to address, so to reduce potential problems, bends should be minimised and any direct contact between the soil pipe and the structure must be avoided. To meet the design requirements, many manufacturers offer support systems that reduce the transmission of sound, such as that shown in Figure 3.
As discussed by Lewis and Swaffield, when considering noise transmission through building structures the so-called ‘mass law’ applies. A 230mm brick wall (400 kg·m-2), for example, will provide attenuation of about 50 dB, a 115mm brick wall 45 dB, and a partition weighing 50 kg·m-2 about 35 dB. ‘Indirect’ or ‘flanking’ pathways create a means by which sound can bypass a dividing wall or floor through poor detailing, particularly where surfaces meet. The openings around pipes must be treated effectively to reduce noise transmission, as shown in Figure 3. Determining the actual level in the receiving room is complex, and will depend on factors2 including: sound insulation and area of the separating wall or floor; the volume of the receiving room; the flanking transmission; and the amount of absorbing material (for example, furniture) in the receiving room.
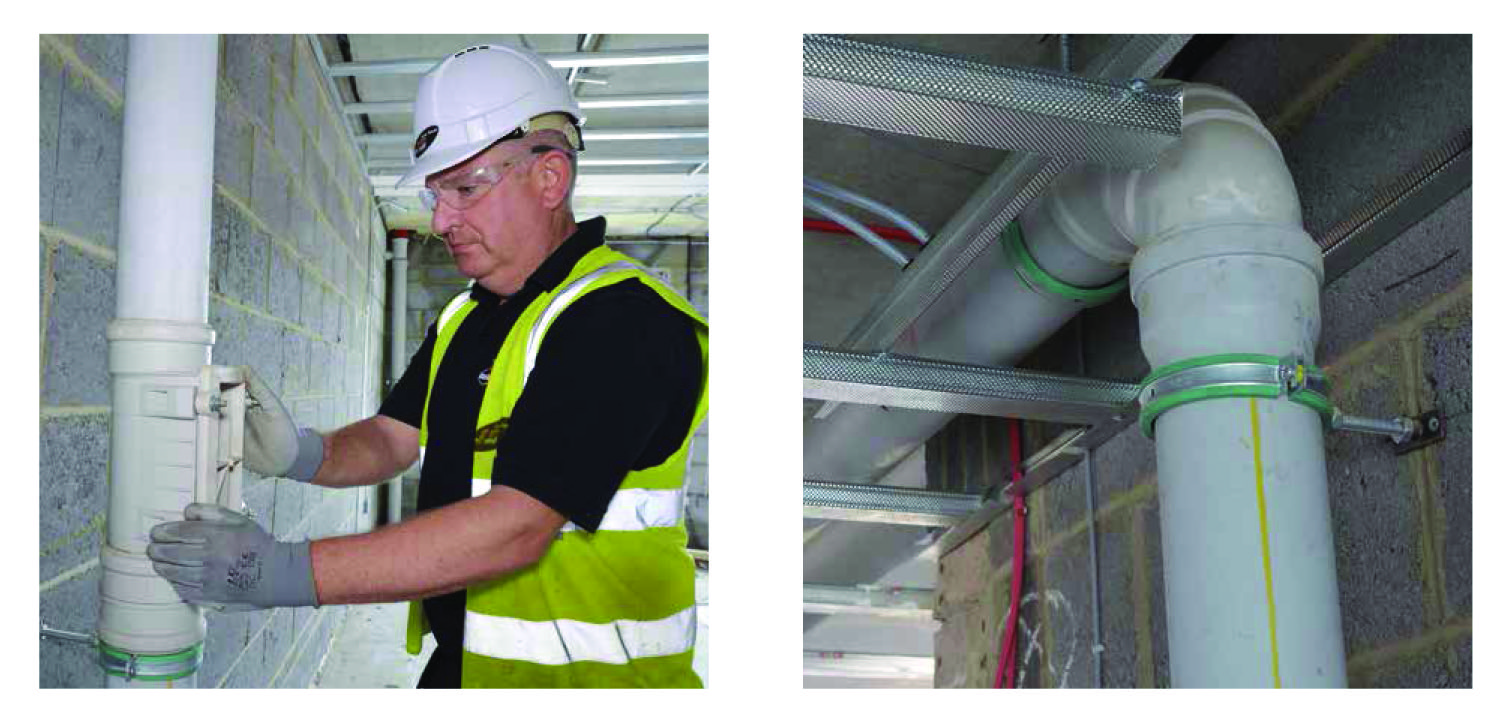
Figure 4: Installation of ‘acoustic soil’ in a care home (Source: Wavin)
As well as airborne noise from soil systems, problems resulting from structure-borne sound that cannot be successfully dealt with by the building’s insulation can often be remedied using an appropriately robust ‘acoustic’ soil and waste system. So, for example, ‘acoustic soil’ – such as the system shown in Figure 4 – has a higher mass than traditional plastic soil pipe, and the structure of the plastic is designed to reduce the structure-borne sound. In conjunction with using appropriately resilient ‘acoustic’ fixings, this can enable an improved level of soundproofing, without requiring additional acoustic insulation wrapping or architectural ductwork that normal plastic pipework may require. The system illustrated here employs push-fit jointing sections, with a resilient gasket that isolates the pipe from the fitting, to stop noise passing along the pipe from one space to another.
Having installed the system to the appropriate standards, the normal on-site airborne and impact noise tests only measure the performance of the whole room – without testing the performance of the soil stack when in use. Any design or installation errors could easily be overlooked, and warrant a planned assessment of the acoustic performance when WCs are being flushed or baths emptied.
© Tim Dwyer, 2016.
References:
1 England Building Regulations Approved Document E Resistance to the passage of sound, 2015 amendment.
2 BS8233:2014 Guidance on sound insulation and noise reduction for buildings, BSI Standards, 2014.
3 CIBSE Guide B5, Noise and vibration control for HVAC, CIBSE, 2002.
4 Wise, A. F. E. and Swaffield, J. A., Water, Sanitary and Waste Services for Buildings, Chapter 10, Butterworth-Heinemann, 2002.