There are many stunning examples of signifi cantly glazed buildings that, through thoughtful design, can also have moderate cooling loads. To achieve effective designs requires a good understanding of how the building responds to changes in the external environment. Some of the aspects of thermal mass (and admittance) have been covered in earlier articles (January 2013 and May 2011). This article will consider the solar geometry and the effect of climatic attenuation on incident solar radiation that may then be applied to evaluate the effectiveness of shading devices and calculate solar heat gain through fenestration.
Solar gain through glazing will be primarily dependent on the intensity of the incident solar radiation and the relative position of the sun to the surface of the translucent material. There are standard methods and algorithms that have been developed to synthesise solar data – these are given in detail in CIBSE Guide J.1
However, the terminology used and the assumed background knowledge may be unfamiliar to many building professionals.
The intensity of the sun
At the outer reaches of the earth’s atmosphere, the incident sun’s energy has an intensity of about 1,367 W·m-2 and, since the sun is large and 149,600,000 km from the earth, the sun’s rays are assumed as practically parallel on entering the atmosphere. As the electromagnetic radiation passes through the atmosphere, it is attenuated by gases, aerosols and particulate matter. The attenuation (that, apart from ultraviolet, principally takes place in the troposphere) and the scattering (known as ‘Rayleigh scattering’) of the solar radiation will relate to the depth of atmosphere through which the radiation passes.
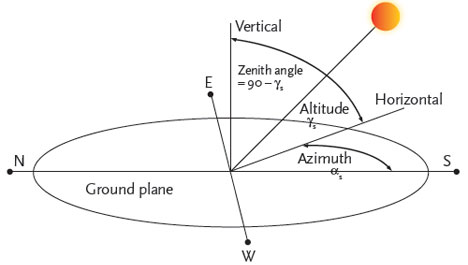
Figure 1: The relative position of the sun to a point on the earth’s surface
The effective atmospheric depth will be affected by the apparent angle of the sun’s rays with the ground (the relative solar position is illustrated in Figure 1). The actual path length (Figure 2) through the atmosphere is described using the term ‘relative air mass’, AM. This value will depend on the height of the site above sea level and the solar altitude – at higher values of relative air mass, less solar radiation will reach the earth’s surface and the higher frequencies (blue/green light) are increasingly scattered, so leading to light dominated by lower frequency red/orange.
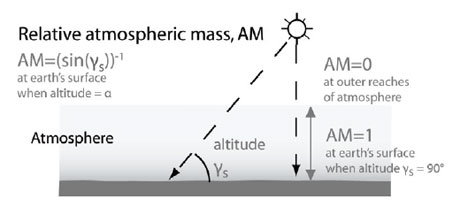
Figure 2: The effect of solar altitude on atmospheric depth
An AM value of 2 (relating to a solar altitude angle of 30°) is typically used in standard data for solar irradiance.
To account for the effect of the climate (including permanent pollution) at a particular location, the ‘Linke turbidity factor’, TLK, represents the multiple of clean dry atmospheres that would produce the equivalent solar attenuation to the actual atmospheric conditions at a particular location. This ranges from a value of 2 for very clean, cold air to 3 for warm air, and above 6 for a location with heavily polluted air.
When the solar radiation reaches the earth’s surface the direct component of the solar energy, known as the ‘beam irradiance’ (measured perpendicular to the direction of the sun) will be affected by the site elevation. Locations such as Denver, Colorado – which is 1.6 km above sea level – have a significantly shorter atmospheric path (with a troposphere depth of around 17 km above Denver) than will a location at the same latitude but at sea level. By comparison, in the UK the highest town is 500 m above sea level. To account for this, an altitude correction factor is applied to the basic beam irradiance that will also be dependent on the sky clarity. This correction factor is shown in Figure 3 for a Linke turbidity factor of 3.5.

Figure 3: Effect of site elevation in metres on the predicted beam irradiance expressed as a ratio to the sea level beam irradiance at different solar altitude angles (Source: CIBSE Guide J)
After passing through the atmosphere, the normal beam irradiance has a maximum value of approximately 950 W·m-2. In addition to the direct irradiance, there is a diffuse component that – as the name suggests – is non-directional and will depend on the atmospheric (notably climatic) conditions, as well as the surrounding surfaces.
As the Linke turbidity factor increases, the diffuse irradiance at a given solar altitude rises (as indicated in Figure 4), since there is greater scattering of light.
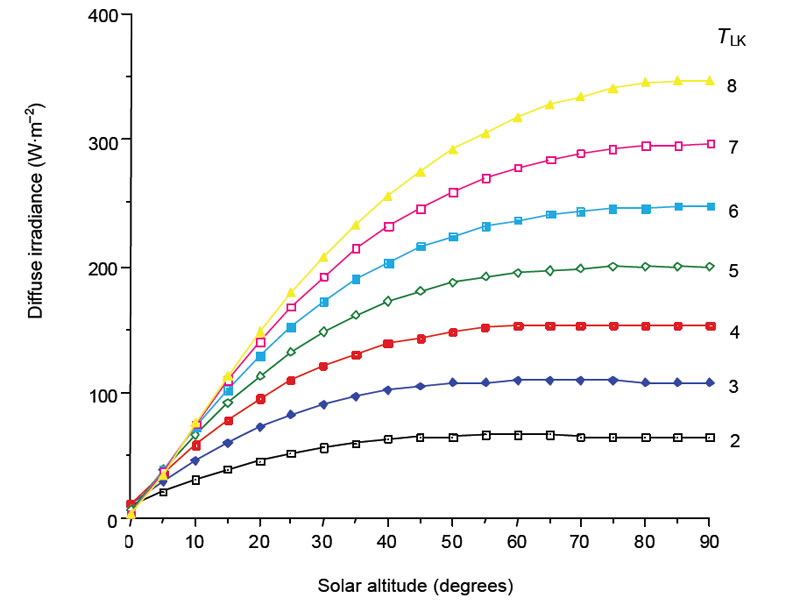
Figure 4: Diffuse irradiance on horizontal surfaces (at sea level) from the clear sky at mean solar distance as a function of solar altitude, for Linke turbidity factor , TLK, values from 2 to 8 (Source: CIBSE Guide J)
The diffuse irradiance typically ranges from 100 W·m-2 for a ‘clear’ sky, up to 450 W·m-2.
The colour and reflectivity of adjacent constructions, ground and vegetation will affect the reflected component of solar radiation – this is considered as diffuse radiation, and its magnitude is directly related to the surface ‘albedo’ (the fraction of sun’s radiation reflected from a surface).
The albedo of different common materials ranges from about 0.14 for tarmacadam to 0.23 for aged concrete. A recent report2 on a project indicates that surrounding surface finishes should play a significant part of the design analysis when considering the environmental performance of buildings, as they may significantly affect heating and cooling loads.
It is normally assumed that, of the reflected diffuse radiation, 50% will strike the adjacent vertical surface, while for sloping surfaces, Guide J provides a simple relationship in terms of the slope angle, ß.
The ground reflected irradiance is given by:
Rgh = ρg · rg · Gc (W·m-2)
the ground slope factor is given by: rg = (1 – cos (β)) / 2 and so for vertical surfaces rg = 0.5
If there is mirror-like ‘specular’ reflection (such as from highly reflective polished metal cladding), the reflected component would need to be specifically modelled for the application.
In common with other sources, CIBSEpublished solar data applies a ground albedo of 0.2 and a Linke turbidity factor of 3.5, with various correction factors, k, being applied to the data to account for localised site conditions.
The ‘global irradiance’, Gc, at a particular surface is the sum of the beam and diffuse components.
The relative position of the sun
The relative position of the sun may be practically determined for any time during the year with simple trigonometry plus some empirical data relating to the earth’s orbit around the sun and the axial tilt (of 23.4°) of the earth that drives the seasonal variation in incident solar radiation.
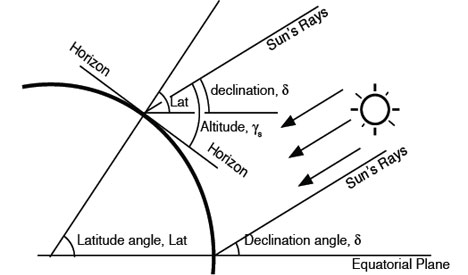
Figure 5: Solar geometry at a po int on the earth’s surface relative to the tangential visual horizon
As shown in Figure 5, the value of solar declination, d, is independent of location but related to the time of year (varying from +23.5° around 20 June to 0° at the vernal and spring equinox, and -23.5° around 22 December, due to the relative tilt of the earth’s axis as the earth revolves around the sun), and may be determined by a simple sinusoidal functions. Only locations in the ‘tropics’ (latitudes between 23.5°N and 23.5°S) can have the sun vertically above (at a solar altitude of 90°, zenith of 0°). When considering a particular location, the angular height of the sun above the horizon, the solar altitude, γs, and its angular position in the horizontal plane, the solar azimuth, αs, may be calculated.
So:
sin(γs) = sin(δ)·sin(Φ)+cos(δ)·cos(Φ)·cos(ω) and,
cos(αs) = (sin(γs)·sin(Φ) – sin(δ)) / (cos(Φ)·cos(γs))
sin(αs) = cos(δ)·sin(ω) / cos(γs)
with the sin(αs) calculation being required to establish the quadrant where .s resides.
omega; = absolute value of the hour angle (e.g., noon = 0°, 2pm = 30°, 9am = 45°, etc.)
Φ = latitude
If sin αs < 0, then αs = –cos-1(cos (αs)); if sin αs > 0, then αs = cos-1(cos (αs)).
CIBSE Guide J provides a full set of formulae that may readily be applied to spreadsheets to provide the relative position of the sun at any particular time.
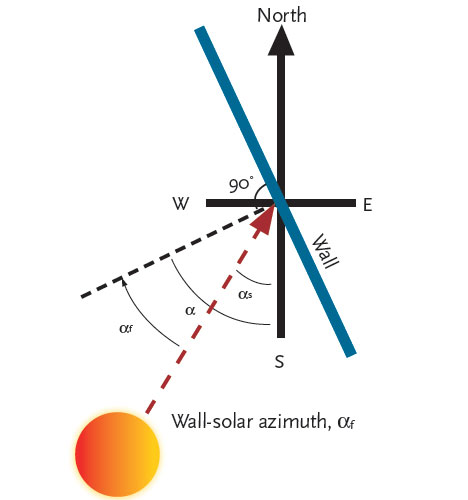
Figure 6: The wall-solar azimuth angle, αf
The purpose of establishing the solar position and the irradiance is to be able to apply it to the surfaces of a building, and so the relative position must be established. As indicated in Figure 6, the angle that the surface faces (in the horizontal plane) is known as wall azimuth angle, α, measured relative to south (in the northern hemisphere). The difference between the wall azimuth angle and the solar azimuth, αs, is known as the wallsolar azimuth, αf, with values to the east of the northsouth meridian negative and values to the west being positive.
So αf = αs – α.
The basic solar data having been determined, the intensity of beam irradiance, B, (W·m2) falling on a horizontal plane may be established from
B = Bn·sin (γs) where Bn is the normal beam irradiance
and for a vertical plane (taking account of both the altitude of the sun and the orientation of the surface)
B = Bn·cos(γs)·cos(αf) where αf is the wallsolar azimuth.
For a sloping surface, it requires a rather more complex set of trigonometric equations, so it is convenient to separately establish the angle of incidence of the solar radiation with a sloping surface
ν(β,α) = cos-1(cos(γs)·cos(αf)·sin(β) + sin(γs)·cos(β))
And so for a sloping surface with a slope β and wall azimuth α …
when ν(β,α) > 0 …. B(β,α) = Bn·cos ν(β,α), otherwise B(β,α) = 0, as the surface will not be exposed to direct sun.
The positional data for the sun is shown conveniently using a sunpath diagram (Figure 7). This cylindrical projection has the azimuth plotted along the horizontal axis, with the altitude plotted vertically. Each of the curves represents the path of the sun throughout a day for each month of the year. As with the preceding solar calculations, the sunpath is represented using local apparent time – this is the sun time (that is, for th e northern hemisphere, midday is when sun is due south). Similar data is available in a tabulated form for all global locations, based on the basic formulae from a number of sources including that on the NOAA Earth System Research Laboratory website at http://1.usa.gov/141WG7W
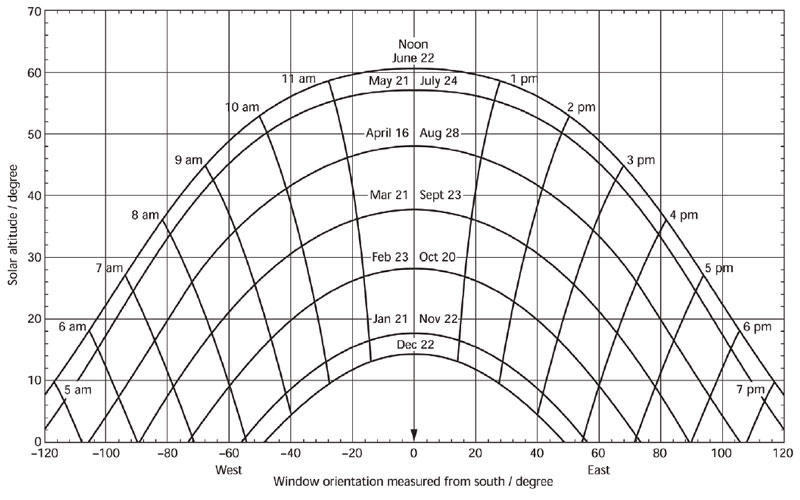
Figure 7: Example sun-path diagram for 52°N latitude related to local apparent time (suntime) (Source: CIBSE Guide A)
The terminology and basic techniques in this article may be applied when determining the potential impact of solar radiation on the external faces of a building. Practically, the most effective way to undertake this is by employing the formulae (together with other underlying calculations from Guide J) using a spreadsheet, or with one of the industry standard modelling packages.
A future followup to this CPD will apply this knowledge to building fenestration, and then examine the effect of the material from this and the earlier CPD articles on moderating cooling loads in buildings.
© Tim Dwyer 2013
References:
- CIBSE Guide J, Weather, solar and illuminance data, CIBSE 2002.
- Yaghoobian, N. et al, Effect of refl ective pavements on building energy use, Urban Climate, Volume 2, December 2012.