Regulation and standardisation of fan power for buildings
The Building Regulations1 in the UK limit the installed power that may be consumed by fans in ventilation systems. In an attempt to capture the associated parasitic power consumption, the limits are given in terms of specific fan power (SFP). The SFP of an air distribution system is the sum of the design watts of the system supply and extract fans, including losses through switchgear and controls (such as inverters), divided by the design air flow rate through that system, and has the unit of W/(litre·s-1).
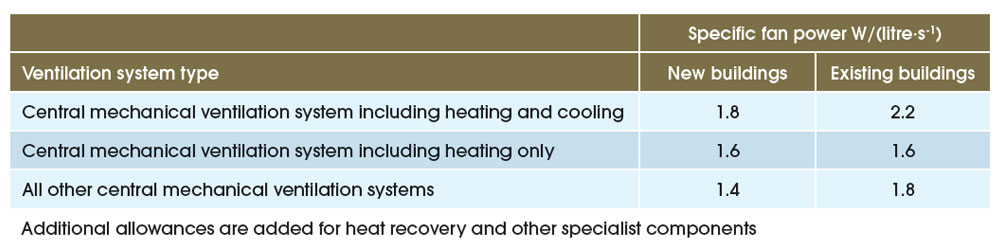
Table 1: Maximum specific fan powers in air distribution systems in buildings to comply with England and Wales Building Regulations 2010
Table 1 provides an extract relating to the requirements for centralised fan systems from the regulations for non-domestic applications (the full document also includes values for distributed fan-powered systems).
These required values are far lower than those traditionally found in buildings2 and so cannot simply be considered ‘business as normal’. Meeting the requirement in the Building Regulations is dependent on both the design of the distribution network and the choice of the fan (and its associated motor and controls). The underlying British Standard, BS EN13779:2007 Ventilation for non-residential buildings – Performance requirements for ventilation and roomconditioning systems, provides extensive and accessible information on the determination of SFP. The design of the ducting, dampers, diffusers and so on is, of course, the primary route to reducing excessive energy use (as discussed in the October 2011 CPD in CIBSE Journal). However, without applying the most effective fan technology, those efforts to reduce air power used in the system will be somewhat wasted. In terms of whole life cost (and total life carbon emissions), there is a limit to how low the SFP can go before the capital cost of the equipment outweighs the operational savings in lower pressure drops – this is discussed at length in CIBSE TM30 Improve life cycle performance of mechanical ventilation systems.
The first phase of the EU ecodesign requirements for fans3 (the ErP directive), which will be implemented in January 2013 (with more stringent requirements following in 2015), provides a standardised methodology to determine a fan’s expected performance relative to benchmarks, and specifies limiting minimum fan efficiencies based on the type of fan. This includes the fan sizes that would be typical in HVAC applications (with an electric input power between 125 W and 500 kW).
The development of these requirements has also encouraged the creation of ISO 12759:2010 – Efficiency Classification for Fans, which categorises the performance of fans into banded efficiency ratings (Fan Efficiency Grade), with the aim of providing more transparency and improved coherence across manufacturers. The end goal is to help prevent fans being sold on the basis of having potentially low capital cost but subsequently consuming excessive amounts of power owing to low practical operating efficiencies.
Across an operating range of 50% to 100% of full load, properly selected motors that drive the fans have a reasonably flat efficiency curve. However, the same cannot be said of most fans that may typically have an efficiency curve similar to that shown in Figure 1.
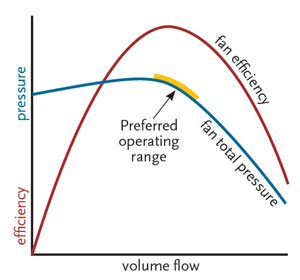
Figure 1: Fan efficiency varies significantly with operating point
This will mean that if the characteristics that determine the resistance to air flow in the system alter (through dirt, blockages or control mechanisms), the operating point may well shift from the preferred operating range and the fan operating efficiency may be significantly reduced. Such a reduction in fan efficiency is likely to reduce, or even negate, any savings that might be expected when using dampers to reduce flowrate.
The ‘air power’, Pu , is given by the product of volume flowrate and system pressure loss, qv x pt. However, the electrical power input, Pe, can be far removed from this, and is expressed in BS EN ISO 5801:20084 as
| Pe = | qv·pf |
| ηr·ηb·ηT·ηm·ηc |
where
Pe is electrical input power in watts;
qv is flow rate, in cubic metres per second;
pf is fan pressure in pascals;
ηr is fan impeller efficiency;
ηb is fan bearing efficiency;
ηT is transmission efficiency;
ηm is motor efficiency; and
ηc is control efficiency.
So, there are clearly many contributing factors requiring consideration in the assessment and selection of the whole fan assembly that will influence the power consumption of the fan. Practically, however, this detailed assessment may be thrown to the wind by not taking sufficient care of the fan’s relationship with the local ductwork system, the so-called ‘system effect’.
The installation of the fan in the system
Fan curves are produced by the manufacturer by testing a fan in standardised conditions as prescribed by the relevant standard (such as BS EN ISO 5801).
The test rig ensures that the air entering the fan has an even (as opposed to turbulent) flow pattern, otherwise the fan will not produce a repeatable performance (leading to reduced flowrate and pressure), and it will create increased noise and vibration.
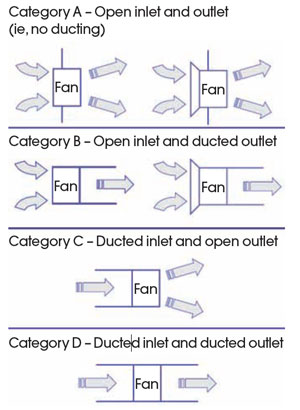
Figure 2: Standard fan testing configurations
(Source: FMA Guidance Note 15)
Internationally there are four standard test configurations, as shown in Figure 2, that attempt to represent the range of basic fan applications. Category D is the one most likely to be closest to the representation of fans in many ventilation and air conditioning systems. Centrifugal fans in air handling units or plenums are likely to be represented by manufacturers as category B, and roof exhaust fans by category A.
Where a duct forms part of the test rig, circular ducts are used with standard transformations converting the rectangular outlet from a centrifugal fan smoothly, and with little energy loss, to a circular duct.
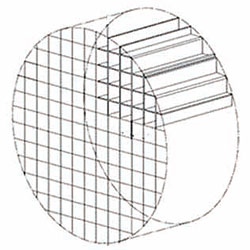
Figure 3: AMCA flow straightener (Source: BS EN 5801)
The test duct would normally include a ‘straightener’ (particularly important for axial flow fans) downstream of the fan outlet (such as the low loss honeycomb straightener shown in Figure 3) that will stop the swirl in the air so that measurements of pressure and velocity may be reliably taken. In a real application, the lack of such a device may mean that the air continues to swirl for many duct diameters’ length and, potentially, adversely affect the reliability of flow measuring points and alter the expected pressure loss through the duct, duct fittings and components.
In all the test categories where there is a length of duct shown (see Figure 2), it is sufficiently long so that it simulates a long, straight duct in real life. However, in real life it is very unlikely that there will be a long, straight unobstructed duct at either the inlet or outlet. The manufacturer’s quoted performance is contingent on the application being similar to the method of test. However, it can be difficult for the designer to calculate the effective ‘derating’ of the fan due to the so-called ‘system effect’ of the variations from the idealised test. In many cases the system effect will only truly come to light as the system is commissioned.
The fan system effect
The number of specific possibilities for the installation of fans in ductwork systems is infinite, and so the variations that may lead to the poor performance of fans are equally numerous. The degradation in performance can be principally attributed to uneven or spinning air at the inlet to the fan and obstructions or inappropriate connections at the fan inlet or outlet.
Of course, this sounds simple (or even flippant) and easy to overcome through proper design and installation. However, the practicalities of site installations and time constraints inevitably mean that there are often sacrifices made when the fans are installed.
There are many publications and websites that provide details of poor fans and how their installation might be improved (for example, http://goo.gl/uwqUy). There is some guidance, such as the Air Movement and Control Association’s (AMCA) Publication 201, that provides numerical factors in an attempt to quantify the system effect that could be taken as increasing the system resistance to take account of typical fan system effect. The impact will be dependent on the specifics of the application.
When the Fan Manufacturers’ Association (FMA) published the Fan and Ductwork Installation Guide in 1993, it compared some of the AMCA 201 values with work undertaken at the UK government’s National Engineering Laboratory (NEL) (as foretold by A.N. Bolton6 in 1990 in one of the rare UK publications that considers this area). As an example, considering inlet bends (some similar to those shown in Figure 4a), the NEL experiments determined values of ‘pressure loss’ for tube axial, vane axial and backward curved centrifugal fans and compared them with AMCA’s data.
There was reasonable agreement with the tube axial fans, but the losses for the vane axial and backward curved centrifugal were significantly different. That is not to say that either was ‘right’ or ‘wrong’, but the important message is that the determination of fan system effect is highly dependent on the particular situation – that is, the details of the duct and fitting fabrication, the manufacture of the fan, and the dynamics of the air.
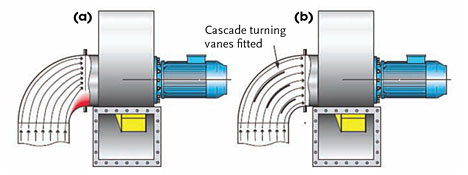
Figure 4: Examples of reducing system effect (Source: CIBSE TM42, 2006)
CIBSE TM42 – Fan Application Guide (created in conjunction with the FMA) has collected together examples of fan installations, and just one of the many examples is shown in Figure 4. The fan in Figure 4 (a) has a ducted input (and probably a ducted output), so is likely to be referred to as a category D application.
However, it is clear that the inlet is being compromised by the bend immediately before the fan inlet, with turbulent flow – indicated by the red areas – affecting the pattern of air entering the fan.
Ideally, there would be a straight length of duct at the entry to the fan (AMCA 201 recommends that bends near the fan’s inlet be located at least three duct diameters upstream of the fan, and notes that they can affect the fan up to five diameters upstream).
Inevitably, there will often be a need for a bend and, if that is the case, the arrangement in Figure 4 (b) would be preferable – a small change producing a significant benefit in fan performance that is likely to halve the effective loss in available fan output. (Downstream of the fan, AMCA’s data for building services applications suggests a straight duct of at least 2.5 duct diameters from centrifugal fans prior to a bend, and half this distance for vane axials.)
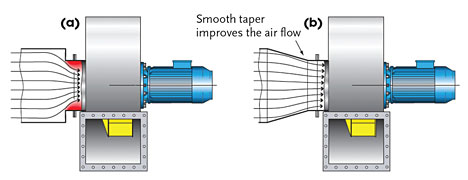
Figure 5: Improving a straight entry to a centrifugal fan
(Source: CIBSE TM42, 2006)
Even straight entries, such as that in Figure 5 (a), can be significantly improved by adding a 15° taper, as in Figure 5 (b).
Fan manufacturers supply some excellent guidance based on the experience of applications, such as that in Figure 6, and will be able to provide specific data that relates to their fan geometry.
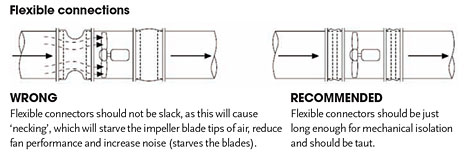
Figure 6: Example of guidance from manufacturer7
If the system effect cannot be avoided, AMCA 201 (or similar) provides a means of estimating its impact on the performance. And later this year, a new ISO standard on Fan System Effects is scheduled for publication (being developed as ISO/NP TR 16219). But, pragmatically, the best solution is to understand the possible consequences of swirl, bends and obstructions on fan performance, and to use good practice to design them out and ensure that they are installed with proper consideration of the system effect.
© Tim Dwyer 2012
Further reading:
The Carbon Trust has freely downloadable guides that give useful guidance in this area – Energy savings in fans and fan systems (GPG383) and
Energy-efficient mechanical ventilation systems (GPG257) – see www.carbontrust.co.uk
The CIBSE Knowledge Portal provides instant access to CIBSE TM42 and CIBSE TM30 – see www.cibseknowledgeportal.co.uk
References
- Non-Domestic Building Services Compliance Guide: 2010 Edition, DCLG, April 2010.
- Specific Fan Power – a tool for better performance of air handling systems, Jorma Railio and Pekka Mäkinen, Clima, 2007.
- http://eur-lex.europa.eu/LexUriServ/LexUriServ.do?uri=OJ:L:2011:090:0008:0021:EN:PDF
Accessed 1 November 2011. - BS EN ISO 5801:2008, BS 848-1:2007 Industrial fans. Performance testing using standardized airways.
- Fan Manufacturers’ Association Guidance Note 1 – Fan Installation Effects – A Guide to Installed Fan Performance, FETA, 2001.
- Installation Effects in Fan Systems, A.N. Bolton, Proceedings of the Institution of Mechanical Engineers, Part A: Journal of Power and Energy August 1990, vol. 204 no. 3 201-215.
- JM Aerofoil Fan Installation Factors, FläktWoods, 2001.