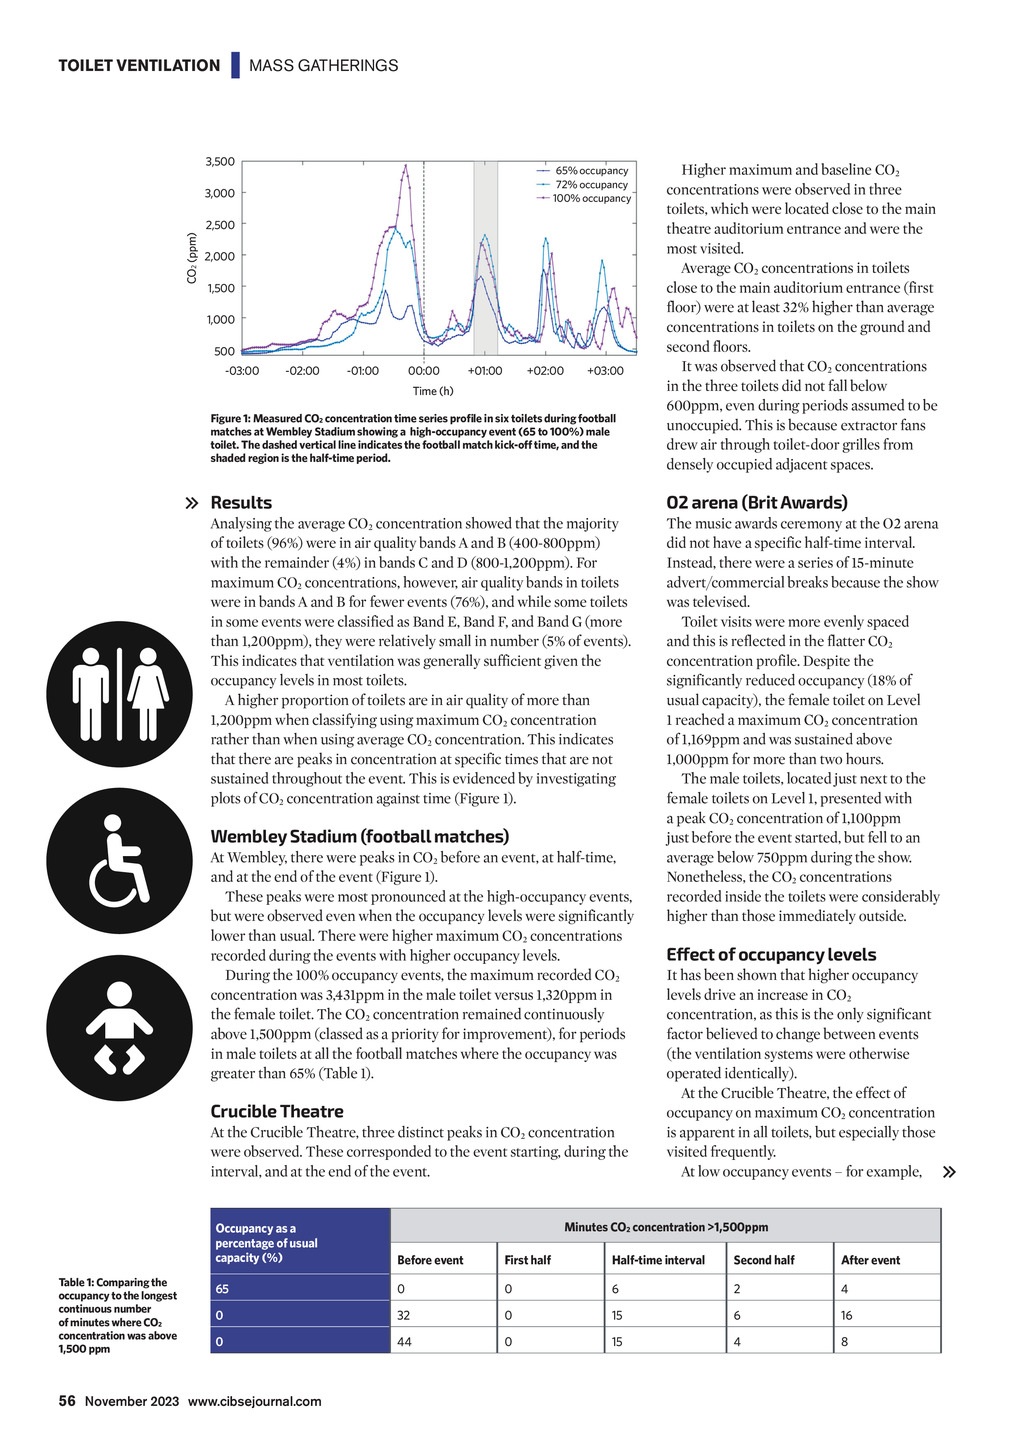

TOILET VENTILATION | MASS GATHERINGS 3,500 65% occupancy 72% occupancy 100% occupancy 3,000 CO2 (ppm) 2,500 2,000 1,500 1,000 500 -03:00 -02:00 -01:00 00:00 +01:00 +02:00 +03:00 Time (h) Figure 1: Measured CO2 concentration time series profile in six toilets during football matches at Wembley Stadium showing a high-occupancy event (65 to 100%) male toilet. The dashed vertical line indicates the football match kick-off time, and the shaded region is the half-time period. Results O2 arena (Brit Awards) Analysing the average CO2 concentration showed that the majority of toilets (96%) were in air quality bands A and B (400-800ppm) with the remainder (4%) in bands C and D (800-1,200ppm). For maximum CO2 concentrations, however, air quality bands in toilets were in bands A and B for fewer events (76%), and while some toilets in some events were classified as Band E, Band F, and Band G (more than 1,200ppm), they were relatively small in number (5% of events). This indicates that ventilation was generally sufficient given the occupancy levels in most toilets. A higher proportion of toilets are in air quality of more than 1,200ppm when classifying using maximum CO2 concentration rather than when using average CO2 concentration. This indicates that there are peaks in concentration at specific times that are not sustained throughout the event. This is evidenced by investigating plots of CO2 concentration against time (Figure 1). The music awards ceremony at the O2 arena did not have a specific half-time interval. Instead, there were a series of 15-minute advert/commercial breaks because the show was televised. Toilet visits were more evenly spaced and this is reflected in the flatter CO2 concentration profile. Despite the significantly reduced occupancy (18% of usual capacity), the female toilet on Level 1 reached a maximum CO2 concentration of 1,169ppm and was sustained above 1,000ppm for more than two hours. The male toilets, located just next to the female toilets on Level 1, presented with a peak CO2 concentration of 1,100ppm just before the event started, but fell to an average below 750ppm during the show. Nonetheless, the CO2 concentrations recorded inside the toilets were considerably higher than those immediately outside. Wembley Stadium (football matches) At Wembley, there were peaks in CO2 before an event, at half-time, and at the end of the event (Figure 1). These peaks were most pronounced at the high-occupancy events, but were observed even when the occupancy levels were significantly lower than usual. There were higher maximum CO2 concentrations recorded during the events with higher occupancy levels. During the 100% occupancy events, the maximum recorded CO2 concentration was 3,431ppm in the male toilet versus 1,320ppm in the female toilet. The CO2 concentration remained continuously above 1,500ppm (classed as a priority for improvement), for periods in male toilets at all the football matches where the occupancy was greater than 65% (Table 1). Crucible Theatre At the Crucible Theatre, three distinct peaks in CO2 concentration were observed. These corresponded to the event starting, during the interval, and at the end of the event. Table 1: Comparing the occupancy to the longest continuous number of minutes where CO2 concentration was above 1,500 ppm Higher maximum and baseline CO2 concentrations were observed in three toilets, which were located close to the main theatre auditorium entrance and were the most visited. Average CO2 concentrations in toilets close to the main auditorium entrance (first floor) were at least 32% higher than average concentrations in toilets on the ground and second floors. It was observed that CO2 concentrations in the three toilets did not fall below 600ppm, even during periods assumed to be unoccupied. This is because extractor fans drew air through toilet-door grilles from densely occupied adjacent spaces. Effect of occupancy levels It has been shown that higher occupancy levels drive an increase in CO2 concentration, as this is the only significant factor believed to change between events (the ventilation systems were otherwise operated identically). At the Crucible Theatre, the effect of occupancy on maximum CO2 concentration is apparent in all toilets, but especially those visited frequently. At low occupancy events for example, Minutes CO2 concentration >1,500ppm Occupancy as a percentage of usual capacity (%) Before event First half Half-time interval Second half After event 65 0 0 6 2 4 0 32 0 15 6 16 0 44 0 15 4 8 56 November 2023 www.cibsejournal.com