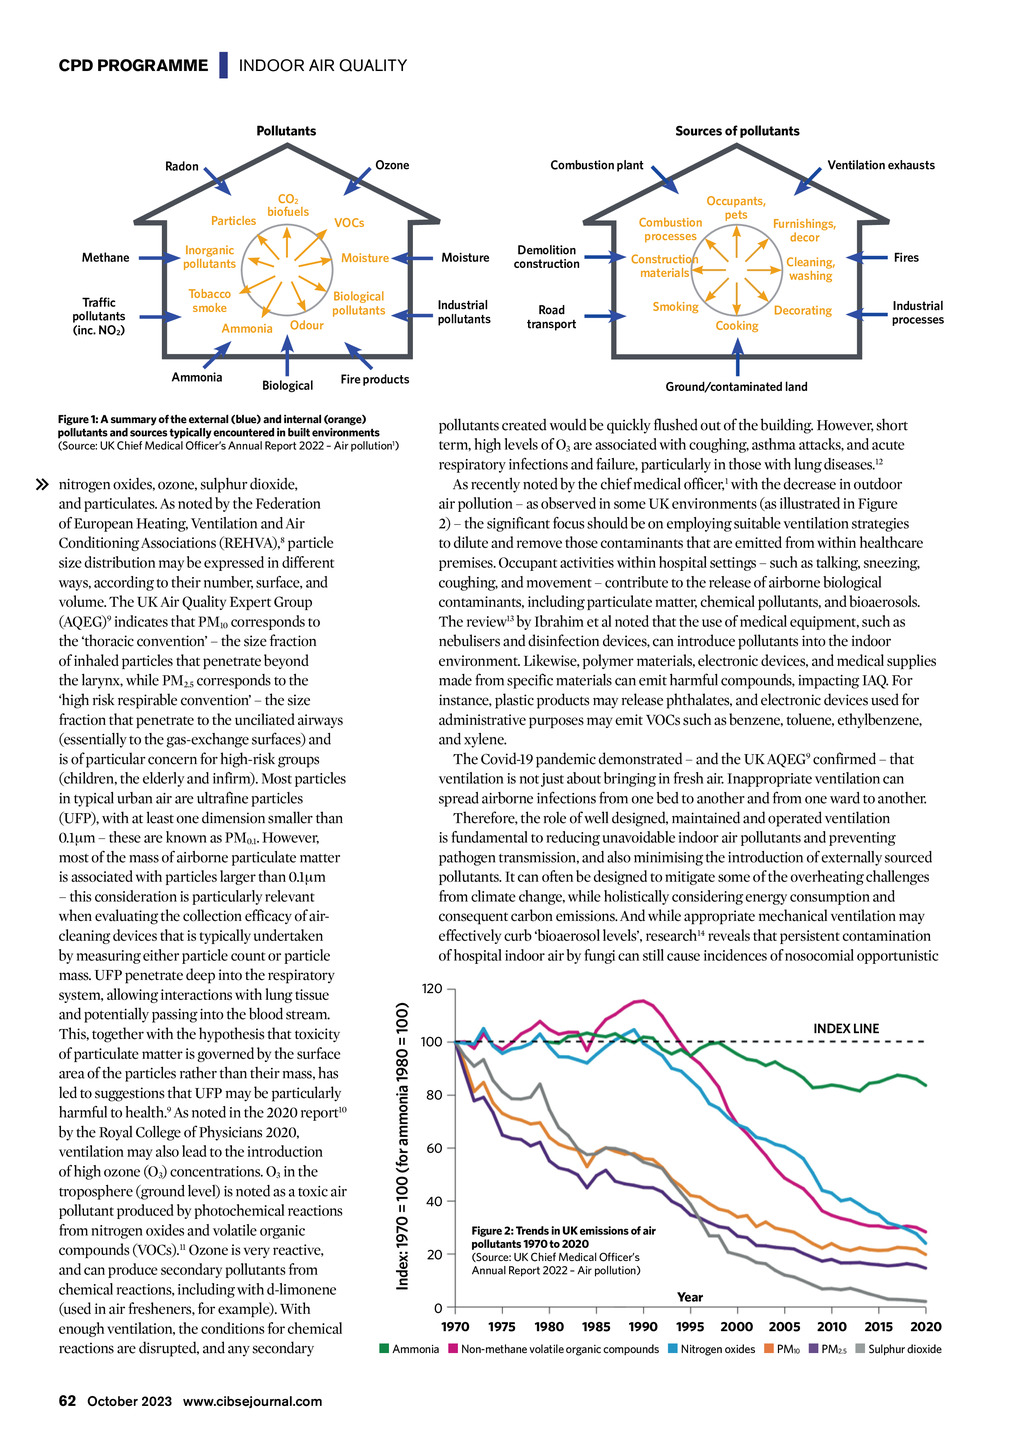
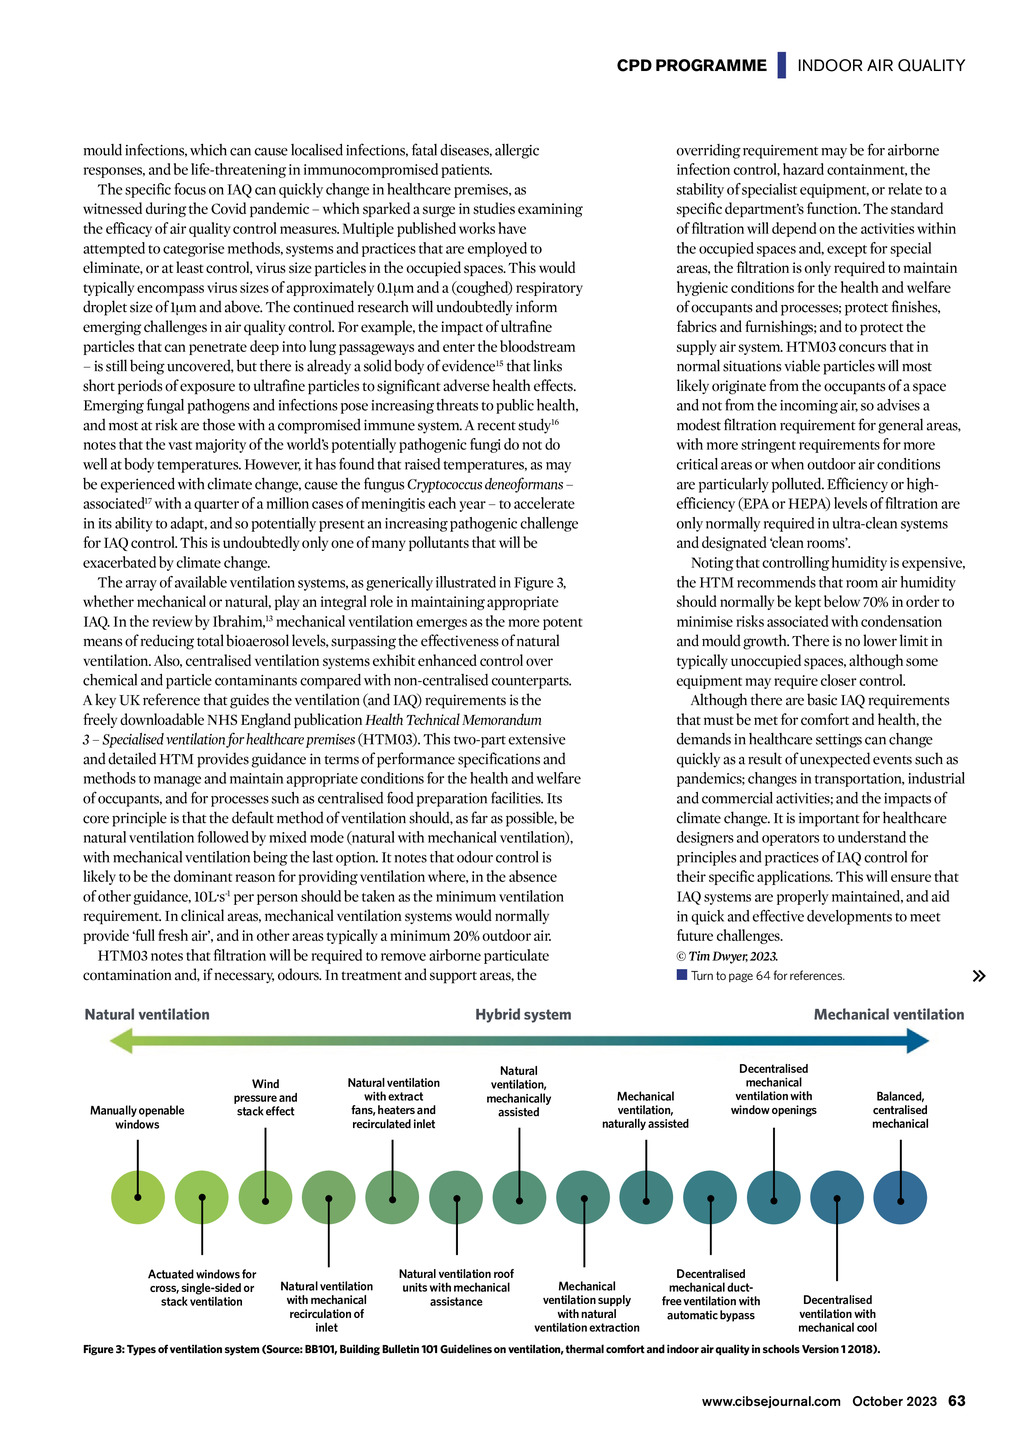

CPD PROGRAMME | INDOOR AIR QUALITY Pollutants Sources of pollutants Particles Methane Traffic pollutants (inc. NO2) Combustion plant Ozone Radon CO2 biofuels Inorganic pollutants Moisture Tobacco smoke Biological pollutants Ammonia Ammonia Odour Biological Moisture Industrial pollutants Road transport Furnishings, decor Fires Cleaning, washing Smoking Industrial processes Decorating Cooking Ground/contaminated land pollutants created would be quickly flushed out of the building. However, short term, high levels of O3 are associated with coughing, asthma attacks, and acute respiratory infections and failure, particularly in those with lung diseases.12 As recently noted by the chief medical officer,1 with the decrease in outdoor air pollution as observed in some UK environments (as illustrated in Figure 2) the significant focus should be on employing suitable ventilation strategies to dilute and remove those contaminants that are emitted from within healthcare premises. Occupant activities within hospital settings such as talking, sneezing, coughing, and movement contribute to the release of airborne biological contaminants, including particulate matter, chemical pollutants, and bioaerosols. The review13 by Ibrahim et al noted that the use of medical equipment, such as nebulisers and disinfection devices, can introduce pollutants into the indoor environment. Likewise, polymer materials, electronic devices, and medical supplies made from specific materials can emit harmful compounds, impacting IAQ. For instance, plastic products may release phthalates, and electronic devices used for administrative purposes may emit VOCs such as benzene, toluene, ethylbenzene, and xylene. The Covid-19 pandemic demonstrated and the UK AQEG9 confirmed that ventilation is not just about bringing in fresh air. Inappropriate ventilation can spread airborne infections from one bed to another and from one ward to another. Therefore, the role of well designed, maintained and operated ventilation is fundamental to reducing unavoidable indoor air pollutants and preventing pathogen transmission, and also minimising the introduction of externally sourced pollutants. It can often be designed to mitigate some of the overheating challenges from climate change, while holistically considering energy consumption and consequent carbon emissions. And while appropriate mechanical ventilation may effectively curb bioaerosol levels, research14 reveals that persistent contamination of hospital indoor air by fungi can still cause incidences of nosocomial opportunistic 120 Index: 1970 = 100 (for ammonia 1980 = 100) nitrogen oxides, ozone, sulphur dioxide, and particulates. As noted by the Federation of European Heating, Ventilation and Air Conditioning Associations (REHVA),8 particle size distribution may be expressed in different ways, according to their number, surface, and volume. The UK Air Quality Expert Group (AQEG)9 indicates that PM10 corresponds to the thoracic convention the size fraction of inhaled particles that penetrate beyond the larynx, while PM2.5 corresponds to the high risk respirable convention the size fraction that penetrate to the unciliated airways (essentially to the gas-exchange surfaces) and is of particular concern for high-risk groups (children, the elderly and infirm). Most particles in typical urban air are ultrafine particles (UFP), with at least one dimension smaller than 0.1m these are known as PM0.1. However, most of the mass of airborne particulate matter is associated with particles larger than 0.1m this consideration is particularly relevant when evaluating the collection efficacy of aircleaning devices that is typically undertaken by measuring either particle count or particle mass. UFP penetrate deep into the respiratory system, allowing interactions with lung tissue and potentially passing into the blood stream. This, together with the hypothesis that toxicity of particulate matter is governed by the surface area of the particles rather than their mass, has led to suggestions that UFP may be particularly harmful to health.9 As noted in the 2020 report10 by the Royal College of Physicians 2020, ventilation may also lead to the introduction of high ozone (O3) concentrations. O3 in the troposphere (ground level) is noted as a toxic air pollutant produced by photochemical reactions from nitrogen oxides and volatile organic compounds (VOCs).11 Ozone is very reactive, and can produce secondary pollutants from chemical reactions, including with d-limonene (used in air fresheners, for example). With enough ventilation, the conditions for chemical reactions are disrupted, and any secondary Occupants, pets Construction materials Fire products Figure 1: A summary of the external (blue) and internal (orange) pollutants and sources typically encountered in built environments (Source: UK Chief Medical Officers Annual Report 2022 Air pollution1) 62 October 2023 www.cibsejournal.com Combustion processes VOCs Demolition construction Ventilation exhausts INDEX LINE 100 80 60 40 20 0 1970 Figure 2: Trends in UK emissions of air pollutants 1970 to 2020 (Source: UK Chief Medical Officers Annual Report 2022 Air pollution) Year 1975 1980 1985 1990 1995 2000 2005 2010 2015 2020 Ammonia Non-methane volatile organic compounds Nitrogen oxides PM10 PM2.5 Sulphur dioxide