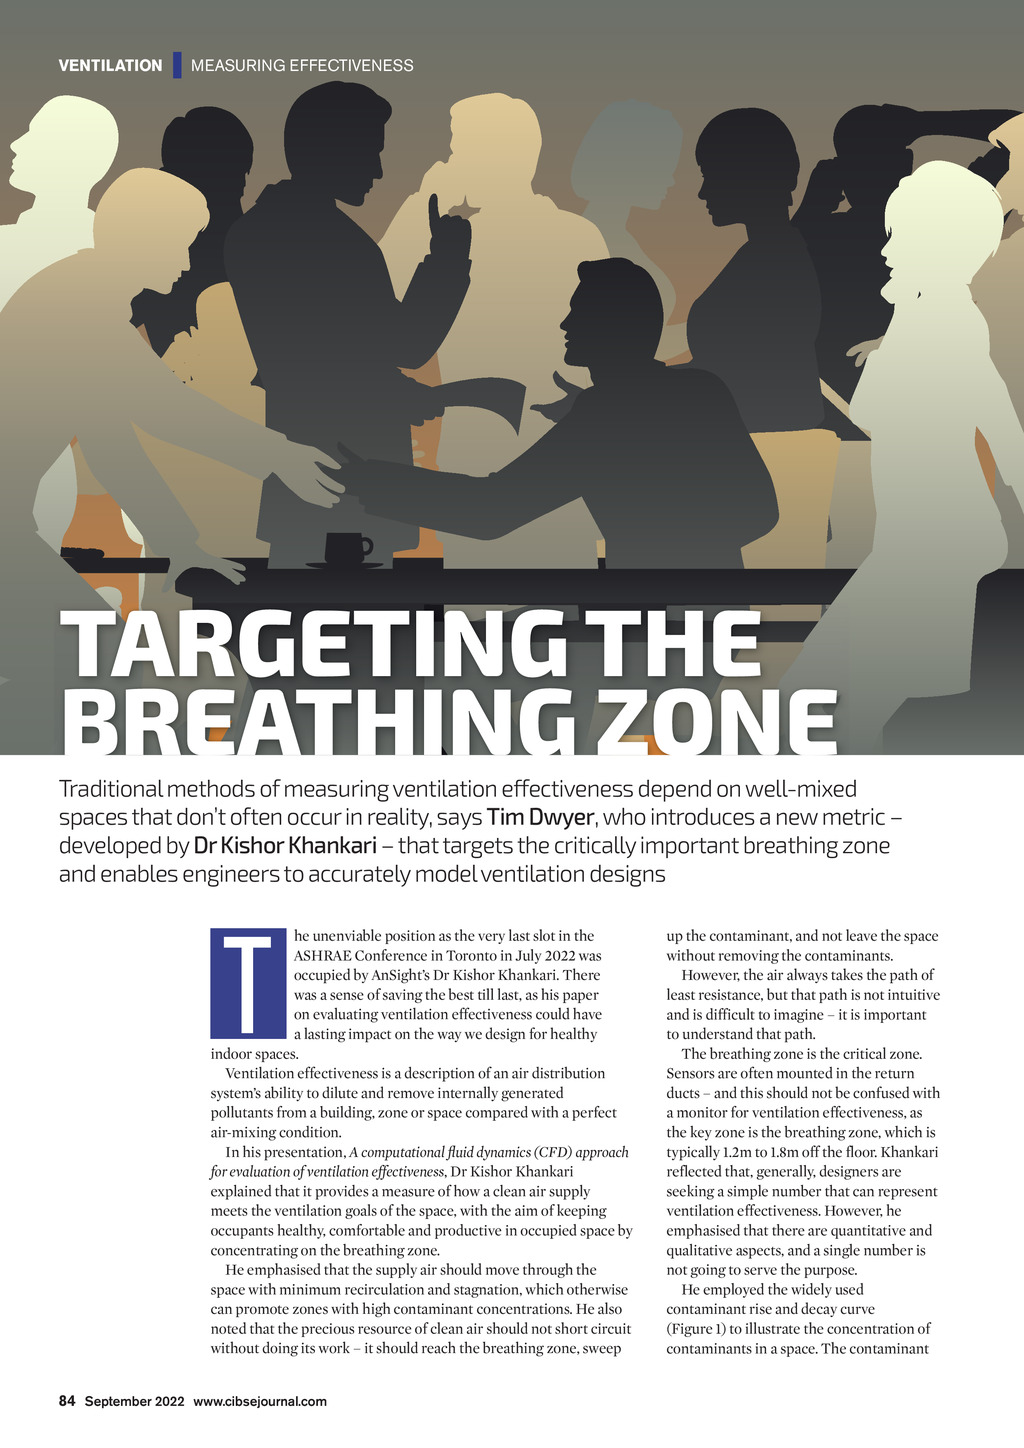
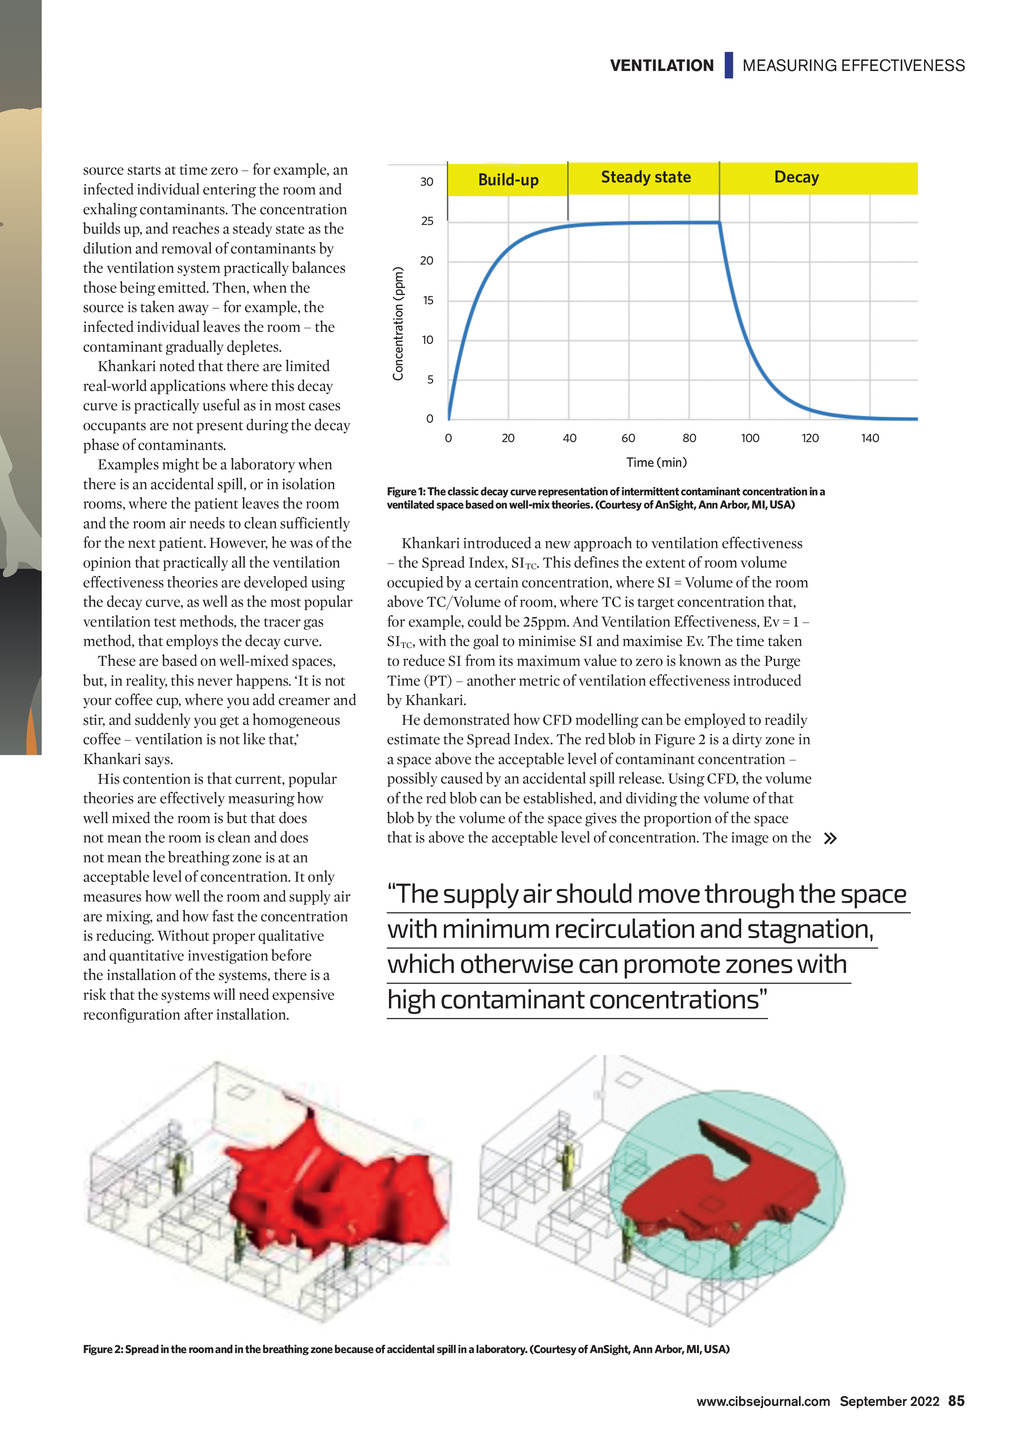

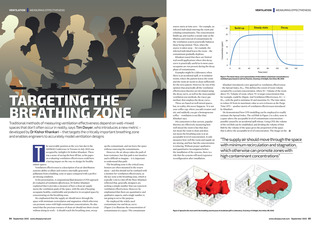
VENTILATION | MEASURING EFFECTIVENESS TARGETING THE BREATHING ZONE Traditional methods of measuring ventilation effectiveness depend on well-mixed spaces that dont often occur in reality, says Tim Dwyer, who introduces a new metric developed by Dr Kishor Khankari that targets the critically important breathing zone and enables engineers to accurately model ventilation designs T he unenviable position as the very last slot in the ASHRAE Conference in Toronto in July 2022 was occupied by AnSights Dr Kishor Khankari. There was a sense of saving the best till last, as his paper on evaluating ventilation effectiveness could have a lasting impact on the way we design for healthy indoor spaces. Ventilation effectiveness is a description of an air distribution systems ability to dilute and remove internally generated pollutants from a building, zone or space compared with a perfect air-mixing condition. In his presentation, A computational uid dynamics (CFD) approach for evaluation of ventilation effectiveness, Dr Kishor Khankari explained that it provides a measure of how a clean air supply meets the ventilation goals of the space, with the aim of keeping occupants healthy, comfortable and productive in occupied space by concentrating on the breathing zone. He emphasised that the supply air should move through the space with minimum recirculation and stagnation, which otherwise can promote zones with high contaminant concentrations. He also noted that the precious resource of clean air should not short circuit without doing its work it should reach the breathing zone, sweep up the contaminant, and not leave the space without removing the contaminants. However, the air always takes the path of least resistance, but that path is not intuitive and is difficult to imagine it is important to understand that path. The breathing zone is the critical zone. Sensors are often mounted in the return ducts and this should not be confused with a monitor for ventilation effectiveness, as the key zone is the breathing zone, which is typically 1.2m to 1.8m off the floor. Khankari reflected that, generally, designers are seeking a simple number that can represent ventilation effectiveness. However, he emphasised that there are quantitative and qualitative aspects, and a single number is not going to serve the purpose. He employed the widely used contaminant rise and decay curve (Figure 1) to illustrate the concentration of contaminants in a space. The contaminant 84 September 2022 www.cibsejournal.com CIBSE Sept 22 pp84-87 CFD Ventilation.indd 84 26/08/2022 17:03