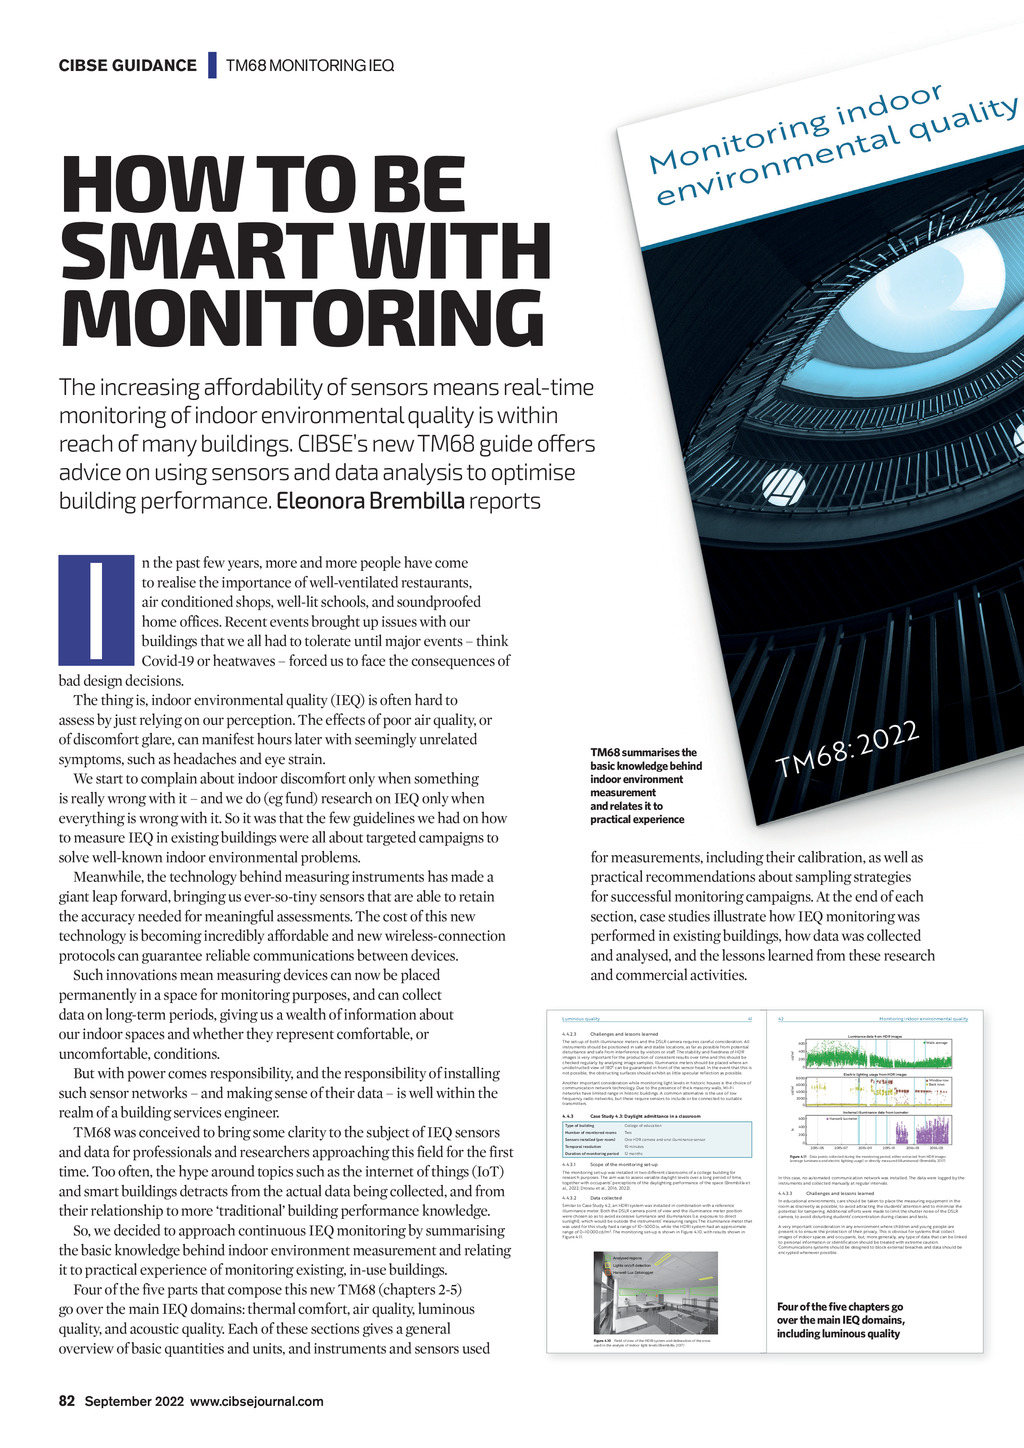

CIBSE GUIDANCE | TM68 MONITORING IEQ HOW TO BE SMART WITH MONITORING The increasing affordability of sensors means real-time monitoring of indoor environmental quality is within reach of many buildings. CIBSEs new TM68 guide offers advice on using sensors and data analysis to optimise building performance. Eleonora Brembilla reports I TM68 summarises the basic knowledge behind indoor environment measurement and relates it to practical experience for measurements, including their calibration, as well as practical recommendations about sampling strategies for successful monitoring campaigns. At the end of each section, case studies illustrate how IEQ monitoring was performed in existing buildings, how data was collected and analysed, and the lessons learned from these research and commercial activities. Luminous quality 4.4.2.3 41 42 Luminance data from HDR images College of education Number of monitored rooms Two Sensors installed (per room) One HDR camera and one illuminance sensor Temporal resolution 10 minutes Duration of monitoring period 12 months 4.4.3.1 4.4.3.2 Data collected Similar to Case Study 4.2, an HDRI system was installed in combination with a reference illuminance meter. Both the DSLR camera point of view and the illuminance meter position were chosen so as to avoid excessive luminance and illuminances (i.e. exposure to direct sunlight), which would be outside the instruments measuring ranges. The illuminance meter that was used for this study had a range of 105000 lx, while the HDRI system had an approximate range of 010 000 cd/m2. The monitoring set-up is shown in Figure 4.10, with results shown in Figure 4.11. cd/m2 200 0 Electric lighting usage from HDR images cd/m2 Window row Back rows 6000 4000 2000 0 Inxternal illuminance data from luxmeter Hanwell luxmeter 600 400 200 0 201505 201507 201509 201511 201601 201603 Figure 4.11 Data points collected during the monitoring period, either extracted from HDR images (average luminance and electric lighting usage) or directly measured (illuminance) (Brembilla, 2017) Scope of the monitoring set-up The monitoring set-up was installed in two different classrooms of a college building for research purposes. The aim was to assess variable daylight levels over a long period of time, together with occupants perceptions of the daylighting performance of the space (Brembilla et al., 2022; Drosou et al., 2016, 2022). 400 8000 Case Study 4.3: Daylight admittance in a classroom Type of building Walls average 600 Another important consideration while monitoring light levels in historic houses is the choice of communication network technology. Due to the presence of thick masonry walls, Wi-Fi networks have limited range in historic buildings. A common alternative is the use of low frequency radio networks, but these require sensors to include or be connected to suitable transmitters. 4.4.3 Monitoring indoor environmental quality Challenges and lessons learned The set-up of both illuminance meters and the DSLR camera requires careful consideration. All instruments should be positioned in safe and stable locations, as far as possible from potential disturbance and safe from interference by visitors or staff. The stability and fixedness of HDR images is very important for the production of consistent results over time and this should be checked regularly by analysing image samples. Illuminance meters should be placed where an unobstructed view of 180 can be guaranteed in front of the sensor head. In the event that this is not possible, the obstructing surfaces should exhibit as little specular reflection as possible. lx n the past few years, more and more people have come to realise the importance of well-ventilated restaurants, air conditioned shops, well-lit schools, and soundproofed home offices. Recent events brought up issues with our buildings that we all had to tolerate until major events think Covid-19 or heatwaves forced us to face the consequences of bad design decisions. The thing is, indoor environmental quality (IEQ) is often hard to assess by just relying on our perception. The effects of poor air quality, or of discomfort glare, can manifest hours later with seemingly unrelated symptoms, such as headaches and eye strain. We start to complain about indoor discomfort only when something is really wrong with it and we do (eg fund) research on IEQ only when everything is wrong with it. So it was that the few guidelines we had on how to measure IEQ in existing buildings were all about targeted campaigns to solve well-known indoor environmental problems. Meanwhile, the technology behind measuring instruments has made a giant leap forward, bringing us ever-so-tiny sensors that are able to retain the accuracy needed for meaningful assessments. The cost of this new technology is becoming incredibly affordable and new wireless-connection protocols can guarantee reliable communications between devices. Such innovations mean measuring devices can now be placed permanently in a space for monitoring purposes, and can collect data on long-term periods, giving us a wealth of information about our indoor spaces and whether they represent comfortable, or uncomfortable, conditions. But with power comes responsibility, and the responsibility of installing such sensor networks and making sense of their data is well within the realm of a building services engineer. TM68 was conceived to bring some clarity to the subject of IEQ sensors and data for professionals and researchers approaching this field for the first time. Too often, the hype around topics such as the internet of things (IoT) and smart buildings detracts from the actual data being collected, and from their relationship to more traditional building performance knowledge. So, we decided to approach continuous IEQ monitoring by summarising the basic knowledge behind indoor environment measurement and relating it to practical experience of monitoring existing, in-use buildings. Four of the five parts that compose this new TM68 (chapters 2-5) go over the main IEQ domains: thermal comfort, air quality, luminous quality, and acoustic quality. Each of these sections gives a general overview of basic quantities and units, and instruments and sensors used In this case, no automated communication network was installed. The data were logged by the instruments and collected manually at regular intervals. 4.4.3.3 Challenges and lessons learned In educational environments, care should be taken to place the measuring equipment in the room as discreetly as possible, to avoid attracting the students attention and to minimise the potential for tampering. Additional efforts were made to limit the shutter noise of the DSLR camera, to avoid disturbing students concentration during classes and tests. A very important consideration in any environment where children and young people are present is to ensure the protection of their privacy. This is obvious for systems that collect images of indoor spaces and occupants, but, more generally, any type of data that can be linked to personal information or identification should be treated with extreme caution. Communications systems should be designed to block external breaches and data should be encrypted whenever possible. Analysed regions Lights on/off detection Hanwell Lux Datalogger Figure 4.10 Field of view of the HDRI system and delineation of the areas used in the analysis of indoor light levels (Brembilla, 2017) CIBSE TM68 layout.indd 41 Four of the ve chapters go over the main IEQ domains, including luminous quality CIBSE 06/07/2022 TM68 layout.indd 12:36 42 06/07/2022 12:36 82 September 2022 www.cibsejournal.com CIBSE Sept 22 pp82-83 TM68.indd 82 26/08/2022 15:42