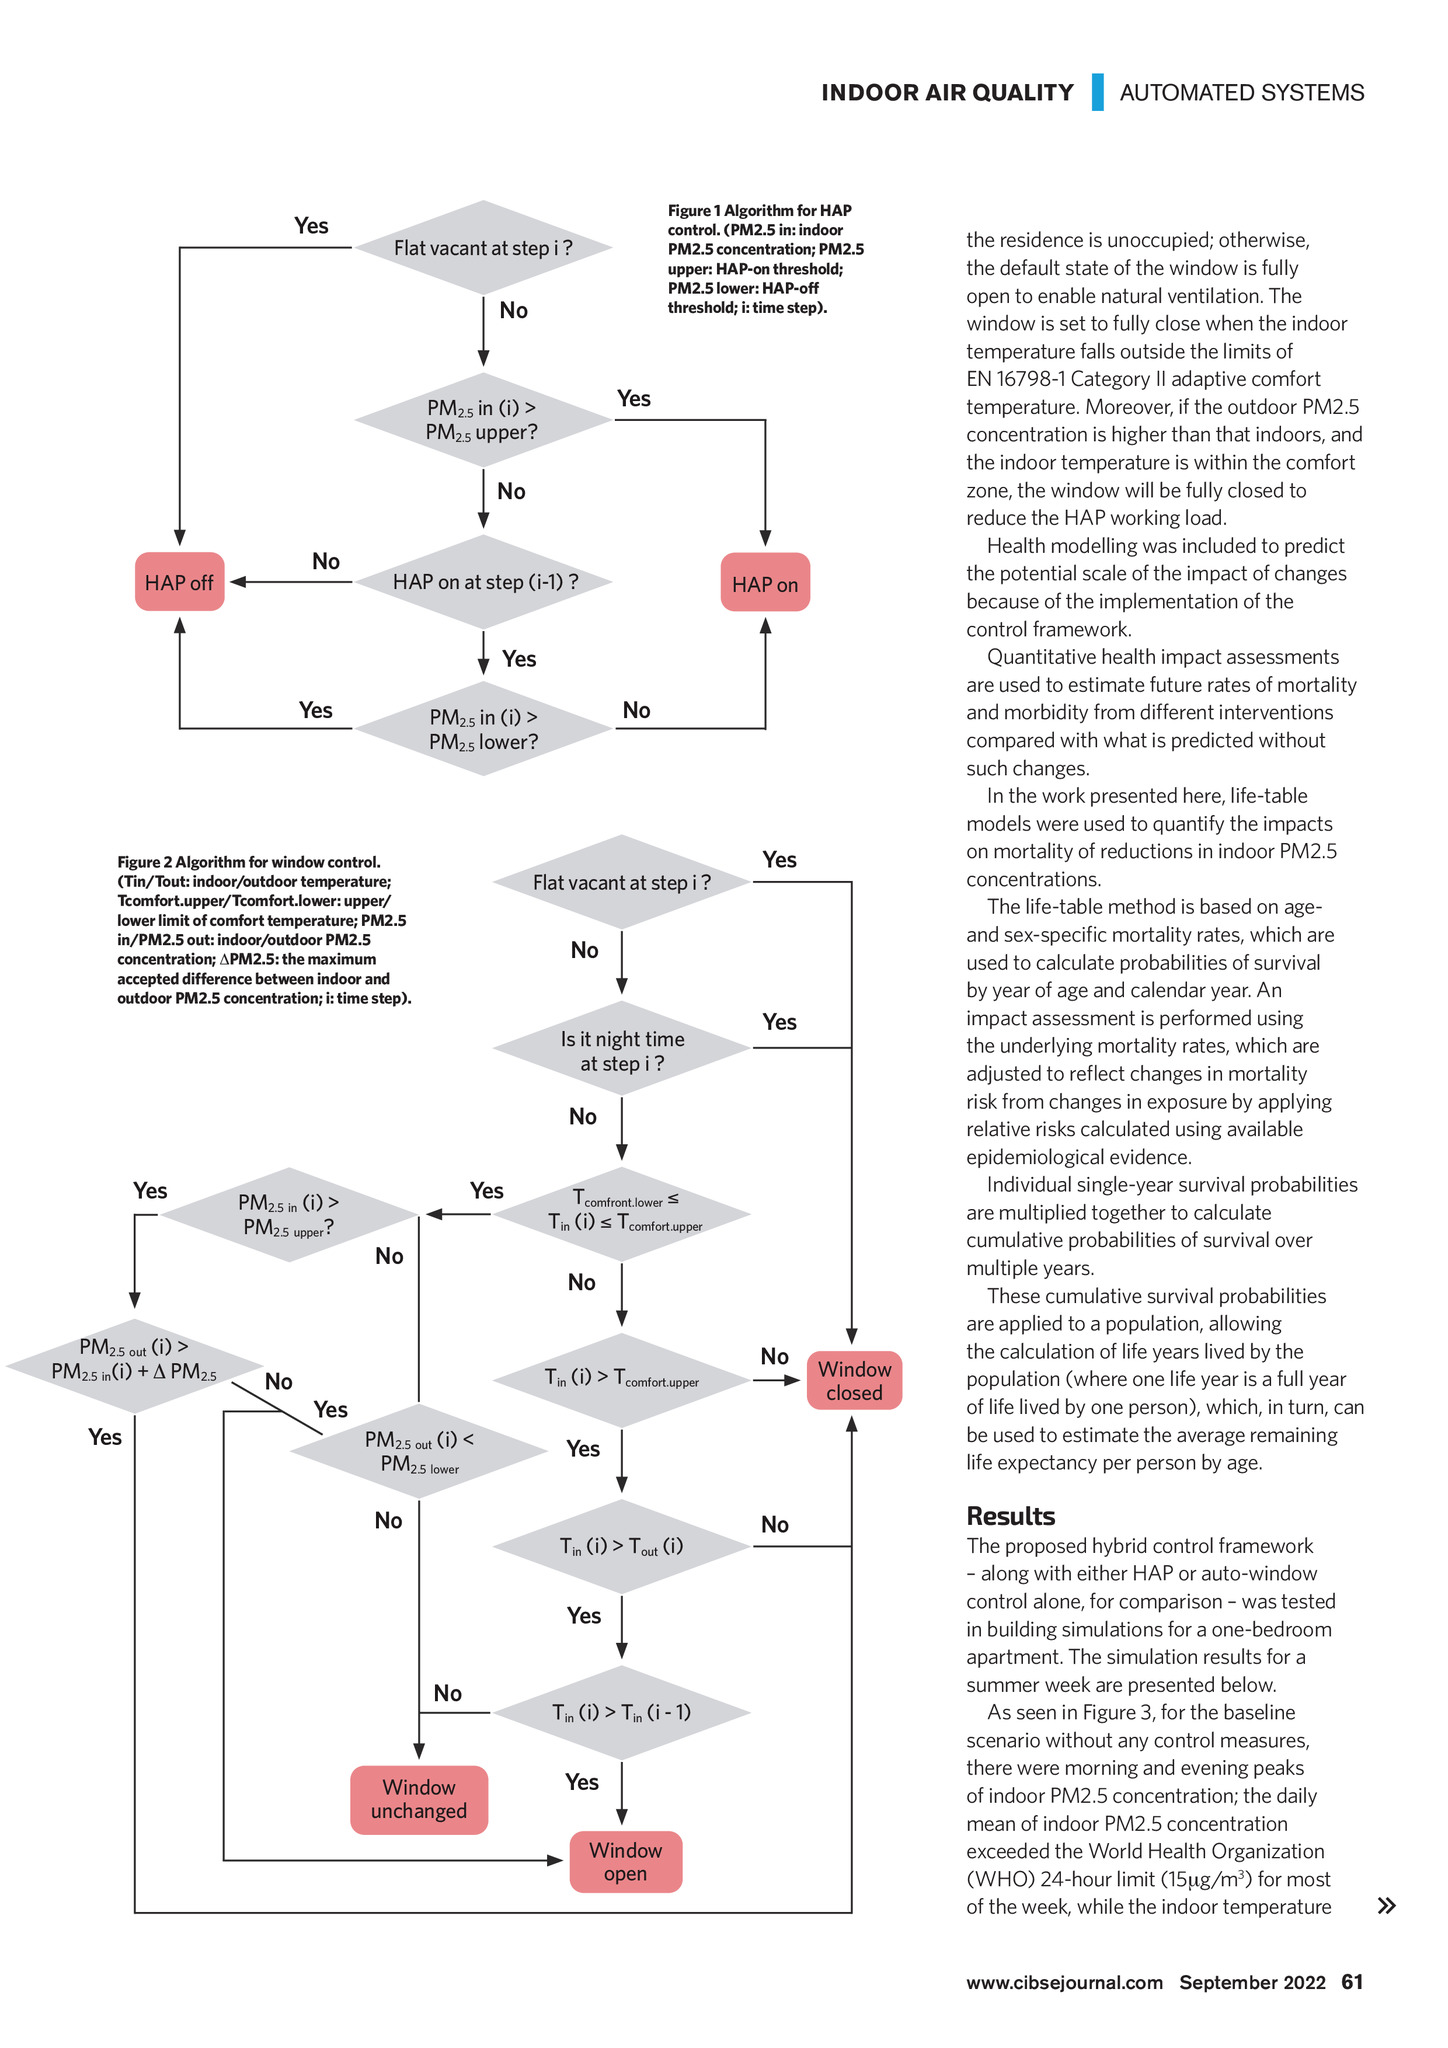
INDOOR AIR QUALITY Yes Figure 1 Algorithm for HAP control. (PM2.5 in: indoor PM2.5 concentration; PM2.5 upper: HAP-on threshold; PM2.5 lower: HAP-off threshold; i: time step). Flat vacant at step i ? No Yes PM2.5 in (i) > PM2.5 upper? No No HAP off HAP on at step (i-1) ? HAP on Yes Yes No PM2.5 in (i) > PM2.5 lower? Figure 2 Algorithm for window control. (Tin/Tout: indoor/outdoor temperature; Tcomfort.upper/Tcomfort.lower: upper/ lower limit of comfort temperature; PM2.5 in/PM2.5 out: indoor/outdoor PM2.5 concentration; PM2.5: the maximum accepted difference between indoor and outdoor PM2.5 concentration; i: time step). Flat vacant at step i ? Yes No Is it night time at step i ? Yes No Yes PM2.5 out (i) > PM2.5 in(i) + PM2.5 Yes PM2.5 in (i) > PM2.5 upper? No Yes No Tcomfront.lower Tin (i) Tcomfort.upper No Tin (i) > Tcomfort.upper Yes PM2.5 out (i) < PM2.5 lower No Yes Tin (i) > Tout (i) Yes No Window unchanged No Tin (i) > Tin (i - 1) Yes Window open No Window closed | AUTOMATED SYSTEMS the residence is unoccupied; otherwise, the default state of the window is fully open to enable natural ventilation. The window is set to fully close when the indoor temperature falls outside the limits of EN 16798-1 Category II adaptive comfort temperature. Moreover, if the outdoor PM2.5 concentration is higher than that indoors, and the indoor temperature is within the comfort zone, the window will be fully closed to reduce the HAP working load. Health modelling was included to predict the potential scale of the impact of changes because of the implementation of the control framework. Quantitative health impact assessments are used to estimate future rates of mortality and morbidity from different interventions compared with what is predicted without such changes. In the work presented here, life-table models were used to quantify the impacts on mortality of reductions in indoor PM2.5 concentrations. The life-table method is based on ageand sex-specific mortality rates, which are used to calculate probabilities of survival by year of age and calendar year. An impact assessment is performed using the underlying mortality rates, which are adjusted to reflect changes in mortality risk from changes in exposure by applying relative risks calculated using available epidemiological evidence. Individual single-year survival probabilities are multiplied together to calculate cumulative probabilities of survival over multiple years. These cumulative survival probabilities are applied to a population, allowing the calculation of life years lived by the population (where one life year is a full year of life lived by one person), which, in turn, can be used to estimate the average remaining life expectancy per person by age. Results The proposed hybrid control framework along with either HAP or auto-window control alone, for comparison was tested in building simulations for a one-bedroom apartment. The simulation results for a summer week are presented below. As seen in Figure 3, for the baseline scenario without any control measures, there were morning and evening peaks of indoor PM2.5 concentration; the daily mean of indoor PM2.5 concentration exceeded the World Health Organization (WHO) 24-hour limit (15g/m3) for most of the week, while the indoor temperature www.cibsejournal.com September 2022 61 CIBSE Sept 22 pp60-62 Smart air quality control Supp.indd 61 26/08/2022 15:47