
What could be simpler than heat networks – pumping hot water around in pipes can’t be too complex, can it? The principle may be straightforward, but you cannot design cost-effective district heating schemes using the standard building services approach – design for the peak with a flow return temperature of 82/71°C does not suffice.
Performance data is revealing that many of the recently built heat networks in the UK are inefficient because of high heat losses.1 There are a number of key reasons why: an overestimation of peak heat demands with cumulative margins added; a lack of consideration of system operation at low loads; little awareness of the magnitude of heat losses; and commissioning and operation not achieving the designed performance. In addition to the cost of these heat losses, the resultant overheating in some communally heated buildings is a serious problem.
The common solution to reducing heat losses is to apply more insulation. This is a bit simplistic and demonstrates a lack of analysis. We need to break the heat loss problem down into the individual factors that affect it: surface area; temperature; as well as insulation levels.
This article will look at the importance of achieving low-return temperatures, because this helps minimise both surface area and temperatures. Good insulation is, of course, essential. On many sites I have seen poorly specified and installed insulation; for example uninsulated – or poorly insulated – pipe supports, valves and commissioning sets.
The return temperature is the key indicator of heat network efficiency. A low return temperature results in a larger delta T, which means lower flow rates are required for the same kW delivered. This means smaller pumps and pipes are needed – the former lowers capital costs and power consumption, while the latter reduces surface area and, so, heat losses. A cooler return pipe also lowers heat losses. Lowering the return temperature to increase the delta T has many benefits over increasing the flow temperature. Lower temperatures can improve the efficiency of boilers, heat pumps and CHPs. Raising the flow temperature could beneficially be considered as part of a variable temperature system, where the flow temperature would only be increased at times of peak demand.
The heat network return temperature is determined by individual return temperatures from five processes: domestic hot water (DHW) generation; space heating system; plant – for example heat interface units (HIUs) – operation when at no load; action of any bypasses on heat network; and heat exchangers on the heat network.
In residential schemes the HIU usually sets the DHW and standby return temperatures. For DHW, cylinders need to be avoided because stored DHW needs to be at 60°C to prevent legionella, and it needs sophisticated controls and commissioning to achieve a below 60°C return temperature when heating a cylinder to 60°C. In Scandinavia, 50°C is an accepted temperature from an instantaneous DHW heater and should usually be able to generate below 30°C return temperature with virtually no commissioning required.
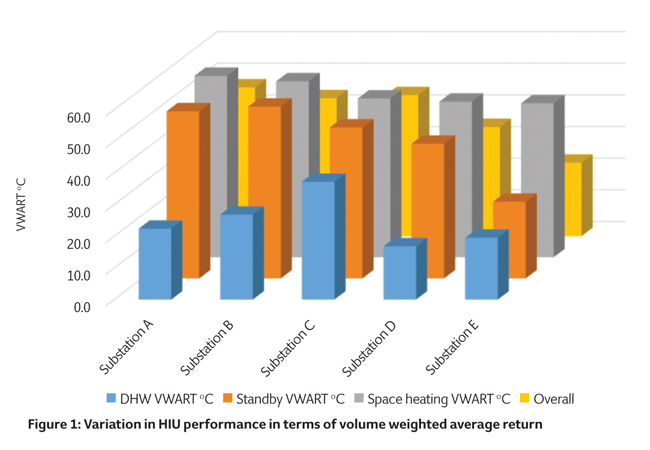
To improve the understanding of HIU performance, DECC research funding was used to develop an HIU test.2 The testing details the performance of the DHW generation, DHW delivery and standby operation. The tested HIUs are from the UK’s largest suppliers, and figures 1 and 2, right, show their performance on the test rig. The key test results are the volume weighted average return temperature (VWART). The figures show the VWART for the DHW, standby and space heating. From these, an overal VWART is calculated to represent the combined average return temperature, based on a typical mix of DHW and space heating. Instantaneous DHW generation from an HIU tends to lead to low DH return temperatures. But there are variations between HIUs.
For space heating, the test assumes a good radiator setup that operates at 70/40°C, but there was quite a variation between HIUs, all developing temperatures much higher than the 40°C secondary return temperatures. In practice, the return temperatures are commonly even higher than this as it is currently rare in the UK to see radiators commissioned to achieve return temperatures as low as 40°C. In the UK, we need to follow Scandinavian experience and use pre-settable TRVs that set the radiators flows low enough to achieve 40°C return temperatures.
The standby VWART showed the greatest variation between HIUs, because of the range of approaches manufactures take to ensure the HIU is kept warm to enable a rapid supply of DHW. Key questions arising are: how fast should DHW be delivered? What is the heat loss penalty for faster DHW delivery? What is the optimum balance between the cost of additional heat loss and faster DHW delivery?
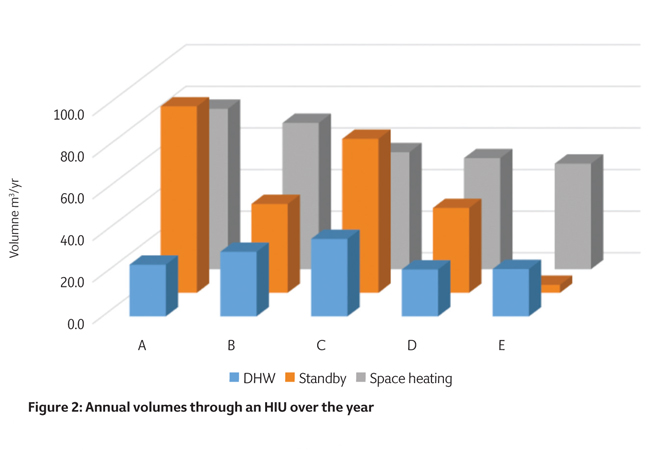
Figure 2 shows the volume of primary DH flow taken by a typical HIU serving a new two-bedroom flat in a year. The graph shows the significance of the HIU performance during standby. Collectively the tests show the range in performance in the HIUs available to the UK market. Designers and specifiers need to understand HIU performance better, to ensure the HIUs installed and commissioned deliver the lowest return temperatures.
Bypasses may be installed on heat networks for flushing, to maintain minimum pump flows or system temperature, and for water treatment purposes. All of these can cause return temperatures to soar if their impacts are not fully thought through (see panel ‘How bypasses can increase return temperatures’).
How bypasses can increase return temperatures
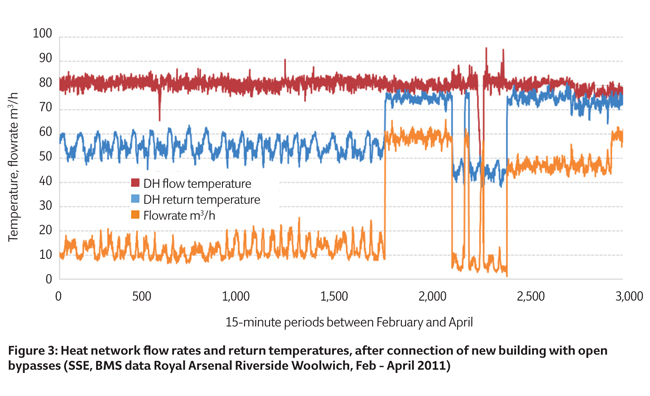
Figure 3 shows the connection of a new building to an existing operating heat network serving 460 flats. The new building of more than 200 flats has some flushing bypasses left open and the flow rate jumps from 10-20m3/hour to 60m3/hour and the delta T reduces from 25-30K to less than 5K. Between time periods 2,000 and 2,500 the DH to the new building is occasionally turned off. At these times the flow rate drops to below 10m3/hour (lower than before because April has lower space heating demands; also a small bypass, used to maintain the water quality in the DH mains to the new building, has also been closed – further reducing the flow rates). Now (later than the period shown) that all bypasses are closed, the return temperature is consistently below 50°C.
It is common to install flushing bypasses above each HIU. On another site, the design and build contractor has designed out these flushing bypasses by flushing at the HIU connections points before the HIU is installed.
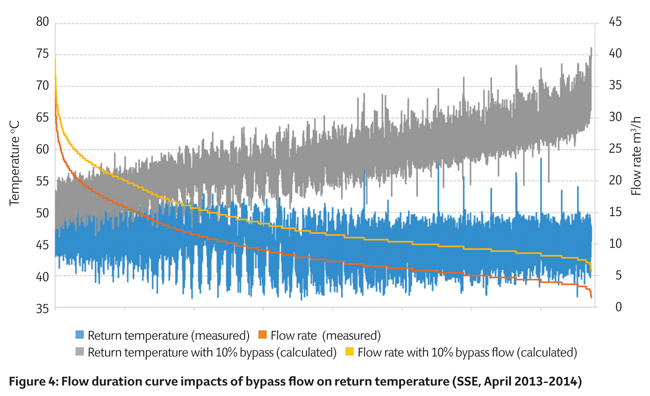
Often bypasses are put in at the tops of risers to maintain minimum pump flows. Figure 4 demonstrates the impact of these ‘small’ minimum flows that, while small at peak loads, are very significant at low DH loads.
Figure 4 shows measured flow and return temperature data at 15 minute intervals for a five-month period from August to end of December. It demonstrates the impact of bypasses with ‘small’ fixed flows, often used to ensure pump minimum flow rates are always maintained. Monitored flow rate and return temperature data, for a system that has no such bypasses, is shown as a flow duration curve (orange line) in Figure 4. The flow duration curve is six months of data sorted into descending order, and shows how much of the time the flow rate is only a fraction of the peak. The blue line is the return temperature recorded at each of the flow measurement points on the flow duration curve. To simulate the impact of a fixed flow rate bypass, operating at all times, a 4.2m3/hour at 80°C flow was added to the recorded DH return data, and the combined flow rate and return temperature calculated. At high flow rates, the simulated bypass flow has little impact but, at low flows, the bypass is more than doubling the DH return flow, so more than half the return flow is water at 80°C – hence the very significant rise in the return temperature. A rate of 4.2m3/hour is 10% of the measured peak flow, but only 5.6% of the installed pump set peak design flow.
To prevent these increases in return temperature, no bypasses should be installed. Instead, the pump set needs to have sufficiently large turndown to operate at the minimum system flow. This can be achieved by: not overestimating the peak; use of multiple smaller pumps; not having full peak redundancy; or use of small jockey pumps alongside the large peak flow pumps.3
A lower return temperature means designers can reduce pipe sizes. Going down one pipe size reduces capacity by 36%, and going down two pipe sizes reduces the capacity by 62%. A worst-case UK heat network system may be designed on a 20°C delta T basis – 80°C/60°C flow/return temperature. But on the basis of better specification and feedback from HIU performance data, the pipes could be sized on a 80/40°C basis for space heat (50% reduction in flow rate) and 80/20°C (67% reduction in flow rate) for DHW. This could potentially allow a reduction of two pipe sizes.
Reducing pipes by one size cuts heat loss on average by 10% (at original temperatures), and reducing pipes by two sizes results in an average heat loss reduction of 19%.
Typically, most new heat networks operate at around 5K delta T – commonly 80/75°C because of poor design and/or commissioning. But if a 45°C return temperature can be achieved, along with the specification of pipes two sizes smaller, then heat losses are reduced by 43%, for an unchanged insulation specification.
New UK heat networks will continue performing poorly until the industry starts learning from operating schemes. Data exists showing that a typical peak diversified heat load for a new London flat is 2.5kW3 and that an HIU delivering DHW can generate a delta T of up to 60K (HIU tests) – so the DH designs need to start reflecting this data to reduce plant and pipe sizes – both of which will reduce capital and operating costs. Designers need to evaluate the operational performance of their schemes so they can learn from their mistakes. Clients and network operators need to understand if there is a wide gap between design and operating performance of their networks before accepting ownership of new heat networks.
The CIBSE/ADE Heat Networks Code of Practice can help address these and other key issues.
References:
- Using data to optimise heat networks pp34-36, CIBSE Journal, May 2016.
- HIU heating, Fairheat.
- Energy efficient district heating in practice – the importance of achieving low return temperatures, M, Crane. 2016, CIBSE Technical Symposium, p 10.
Martin Crane is a director at Carbon Alternatives