

In many a time-constrained design-and-build process, there might be greater ‘value’ to the project in reducing the time of assessment, design and implementation so that the works are completed earlier – possibly to a standard that just meets the essential elements of the client’s brief, but which, in other ways, may still be considered less than ideal. At the other extreme, the (possibly unachievable) ‘perfect’ solution is practically useless if it is delivered so late that it is impossible to implement for the client’s proper benefit– or is just so expensive that it could never be constructed. To deliver holistic ‘value’ is undoubtedly challenging and – as with many engineering processes – should come down to informed and suitably analytical solutions, based on good practice and innovative thinking and application. ‘Value management’ techniques have been developed to provide a systematic approach to delivering value.

Table 1: The present value of a single £100 expenditure projected some years into the future
The formalisation of the techniques of value analysis and value engineering at General Electric in the USA, in the mid-20th century are widely attributed to Lawrence D Miles. His concepts – recognised as an approach to problem-solving through function-based techniques – found their way to many parts of the world and into many environments – including industry, healthcare, and government services.1 Miles’ approach was outlined in his book Techniques of Value Analysis and Engineering: ‘Created for one specific purpose – the identification of unnecessary costs – value analysis is a system, a complete set of techniques, properly arranged, for the sole purpose of efficiently identifying unnecessary cost before, during, or after the fact.’2 His book still offers a wonderful set of examples – many focused on manufacturing rather than building services engineering specifically, but is useful reading nonetheless.
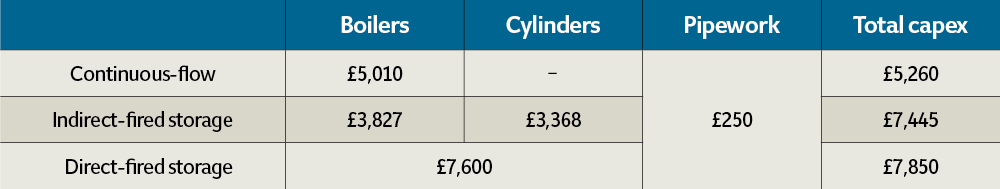
Table 2: Estimated capital costs for the three systems
In building services engineering, it is particularly important that Miles’ quest to root out ‘unnecessary costs’ should go beyond simple financial expenditures, and would include issues of performance – such as comfort, productivity, health and wellbeing – that are influenced by the many parameters defining the building environmental system.
In her recently published book, CIBSE fellow Jackie Portman3 highlights that ‘building services engineers should have the mentality to make value engineering judgements as part of the design and development process. However, due to the fragmented nature and complex interactions characteristic of the design process, value may get lost.’ Importantly, as well as commending the early adoption of a value engineering process, Portman offers a reminder that the ‘resulting decisions from the process may result in changes to the original design’.
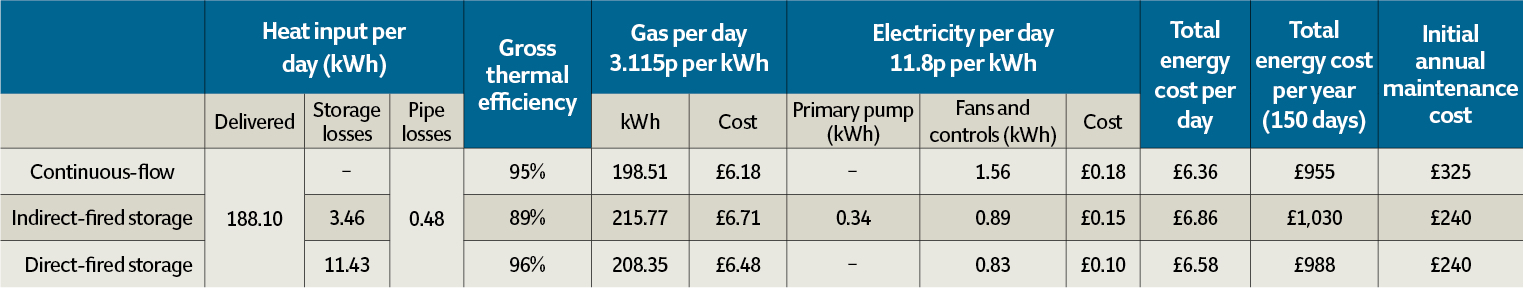
Table 3: Estimated operational costs for the three systems
BSRIA’s Getting value from function4 emphasises the need for ‘value engineering’ to be a continuous process throughout the project, and highlights that ‘true value engineering is not cost-cutting, but continued application of cost-effective engineered solutions’. And to ensure that the innovative practices are properly rewarded, BSRIA goes on to recommend that policies should be adopted ‘whereby the contractors keep their ideas and benefit from them by securing the project’. It would be prudent to extend this to suppliers and manufacturers.

Table 4: Net present value comparison of the three systems
A precautionary note in CIBSE’s AM11 stresses the need properly to account for ‘design changes, including any value engineering during construction of buildings that may have a significant impact on energy efficiency. An update to the predicted energy demands based on the constructed and commissioned building should also be provided, which can then be inserted into the appropriate section of the building log book.’5
This whole process will probably resonate with the advocates of building information modelling (BIM), who will be able to identify that many of the attributes inherent in integrated BIM vastly extend the reach of value assessment. Through parametric modelling enabled by BIM and associated software, there are likely to be far more extensive opportunities for undertaking value engineering and sensitivity analyses.
There are many publications that provide a complete value-management process applicable to projects associated with building services engineering. Although 20 years old, BSRIA’s Value Engineering of Building Services6 creates a solid starting point.
As an integral part of the value-management process, there is inevitably a need to compare the relative costs of solutions.
Net present value (NPV) technique
It can be misleading to compare the real impact of costs by using simple payback (the sum of all the capital expenditure [capex] and operating expenditure [opex] costs over a project’s life), as this does not take account of the benefit of those costs if, for example, that same money had been invested from day one. The basis of an NPV comparison is that money paid out now (capex) is more valuable than the same amount expended later in the life of the project (typically opex). A discount rate is used to convert future expenditure to ‘present values’, so that different scenarios can be compared on an equal basis. The discount rate, r, is an estimate of what annual benefit the money could gain, so can be used to produce a figure to compare how much money would be invested in the present time, to cover the cost over the specified life of a particular variant of a project.
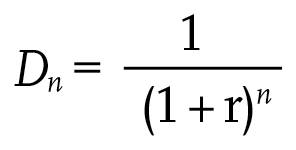
The present value, Dn, at the middle of year 0, of a payment of £1 made at the middle of year n is given by:
The UK government recommends a discount rate of 3.5%7 (for projects up to 30 years).
For example, if £10 was paid out in five years’ time, the present value of that £10 would be:
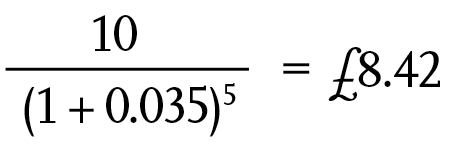
The same calculation can be applied for all expenditures over the life of the project. The diminishing present value of, for example, a single expenditure of £100 spent in a particular year is shown in Table 1. So, to spend £100 in 20 years’ time, would mean that there was a (theoretical) investment of £50 today.
The significance of the method is highlighted by the statement on the UK Cabinet Office’s web page that ‘NPV is the primary criterion for deciding whether government action can be justified’.7 The NPV provides a summation of the present values of the capex and opex over the chosen project life.
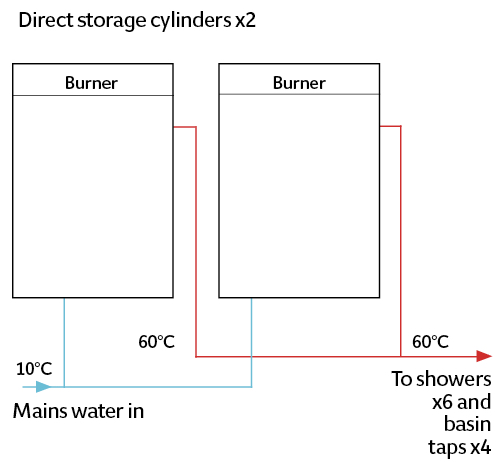
Figure 2: Direct-fired storage hot-water system
The method is only useful as a comparative tool as, for example, if a 10-year life project had two options:
Option one – capex £200 and opex £7 per year, plus a £72 cost (for example, a new filter) in years four and eight.
Option two – capex £210 and opex £20 per year with a ‘long life’ no-change filter.
By using the multipliers (as established previously for Table 1), the NPV of the two options can be calculated:
NPV option one = capex + opex PV + filter replacement PV = 200+(6.76+6.53+6.31+6.10+5.89+5.69+5.50+5.32+5.14+4.96)+(62.7+54.7) = £376
NPV option two = capex + opex PV = 210+(19.32+18.67+18.04+17.43+16.84+16.27+15.72+15.19+14.67+14.18) = £376
In this case, the NPV of both options have the same value, so the decision would have to be made on the other qualitative assessments. The NPV model can be enhanced if, for example, opex costs were thought to increase yearly. Then, in place of using a constant opex for each year, the sum (before being brought to a PV) would be increased accordingly (for example, by 3% per year).
The final result is sensitive to the chosen discount rate – in this case, a higher discount rate would have favoured option one, since the impact of the present value of the future expenditures (the filters) would have been lessened.
Applying NPV
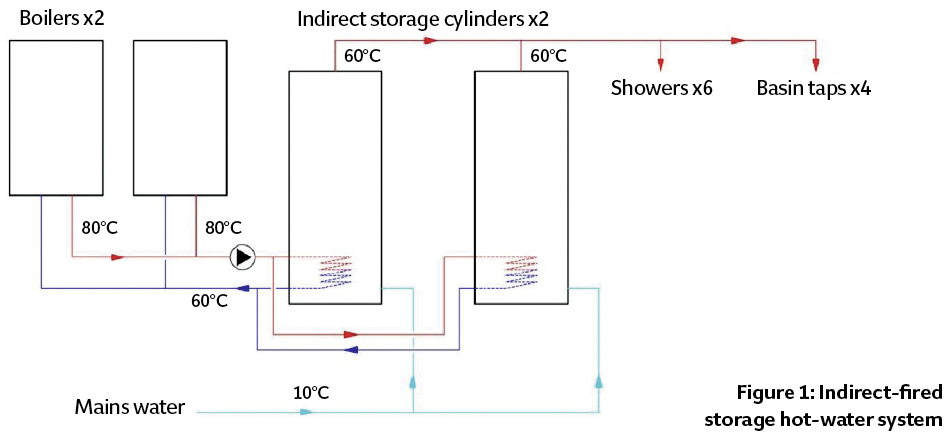
To illustrate how that NPV can be applied in the comparison of alternative hot water heating systems, consider a (simplified) system for a shower block in a holiday camp, operating 150 days a year, with six showers and four basin taps. Figure 1 shows a traditional indirect-fired storage hot-water system, Figure 2 a direct-fired storage system, and Figure 3 a system with a continuous-flow water heater. (As the pipework is short, there was no need for a recirculating return pipe). These provide the basis of a comparison to determine the lowest NPV over 20 years (based on the calculation in an independent report produced by a consultant for a manufacturer8).
From an analysis of the ‘loading units’ of the appliances, an overall design flow rate of 0.5 L·s-1 was determined that, if mixed to 40°C, would equate to an instantaneous heat input of approximately 63kW (from mass flow rate x specific heat capacity x temperature rise, assuming the mains water entered at 10°C). An hourly usage profile for a typical day was assumed, with a total daily usage of 5,400 litres of water at 40°C and a peak hourly usage of 1,800 litres. The boilers’ electrical load was taken as 15W in standby and 60W when operating (that is, to cover controls and combustion fans). For the energy required to deal with the instantaneous hot-water demand, the analysis assumed that the bulk of the hot-water demand would come from the showers. Each shower would typically have a flow rate of around nine litres per minute, which – at an outlet temperature of 40°C – would equate to a load of around 19kW each.
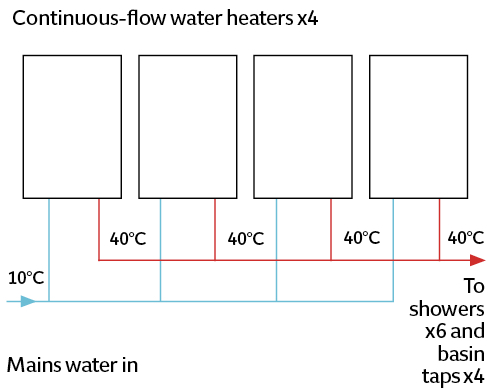
Figure 3: Continuous-flow hot-water system
For the indirect-fired storage option, the analysis was based on a pair of 40kW natural gas boilers heating a pair of 400-litre cylinders. The factory-insulated cylinders have a standing heat loss of 72W with water stored at 60°C. The boilers were assumed to have a gross efficiency of 89%, based on flow of 80°C and return of 60°C. The specific pump power of the primary pump was assumed as 75W per L·s-1.
For the direct-fired storage option, the analysis was based on a pair of 230-litre cylinders with integral burners, each with around 37kW output, and standing losses are 240W per cylinder, based on water being stored at 60°C. The gross thermal efficiency was assumed to be 96%.
For the continuous-flow option, the analysis was based on four modular water heaters that each have a nominal output of 48kW. For this particular application, because there is a very short run of pipework between the water heaters and the fixtures, it was deemed possible8 for the water heaters to generate water at 40°C, and the risk of Legionella would be dealt with by regular flushing of the system. For the load of one shower (19kW), a single continuous-flow water heater would operate with an efficiency of 95% – based on the manufacturer’s performance curve – and, as the hot water demand increases, it was assumed that the modular nature of this particular configuration would allow 95% efficiency to be maintained for the bulk of the demand.
The NPV analysis included the initial capital costs, projected annual fuel costs, and estimated annual servicing costs. End-of-life costs have been ignored, as the residual scrap value of the equipment would typically be offset by the cost of removal and disposal.
The capital costs were taken from standard pricing tables and manufacturers’ literature, and are shown in Table 2.
The annual fuel cost assumes the daily fuel consumption occurs for 150 days each year (the summer holiday season). The servicing costs are based on £130 a year per boiler, and £160 a year for a boiler and cylinder, and where there are multiple units, the service cost is discounted by 50% for each subsequent unit. The servicing costs were assumed to increase by 2% each year.
The annual operating costs are shown in Table 3.
The usage profile for this case study is particularly suited to continuous-flow systems – that is, high but infrequent demand over the day – which is why there is an advantage in fuel consumption over the storage systems.
The resulting NPVs were calculated in the same way as the earlier example, applying a discount rate of 3.5%. The comparative NPV of the three systems is summarised in Table 4, which shows the NPV of the continuous-flow system is around 6% to 7% lower than those of the two storage systems, based on a 20-year analysis period for this particular installation.
© Tim Dwyer, 2016.
Further reading:
For some wonderful historical perspective on the overall approach and techniques, the e-book version of Lawrence D Miles’ Techniques of Value Analysis and Engineering: 3rd Edition is full of great examples. Beyond that, there is no shortage of texts available via the web. A great place to learn about parametric analysis is the PhD thesis and subsequent writings at www.danieldavis.com
References:
- The Lawrence D. Miles Value Engineering Reference Center Collection – accessed 24 August 2016.
- Miles, L D, Techniques of Value Analysis and Engineering: 3rd Edition, Lawrence D Miles Value Foundation (Kindle Edition 2015).
- Portman, J, Building services engineering: after design, during construction, Wiley, 2016.
- See F gas in refrigeration, air conditioning and fire protection systems
- CIBSE AM11 Building performance modelling.
- Hayden, G W and Parsloe C J, BSRIA AG 15/96 Value Engineering of Building Services, BSRIA 1996.
- Discount rates and net present value – accessed 24 August 2016.
- Life-cycle study of continuous flow water heating – report for Rinnai by Aecom, 2016 (available by request from Rinnai).