There are great opportunities to reduce the energy use and carbon footprint of buildings through careful system selection, the use of renewable energy sources and the education of occupants. However, the best way to reduce the environmental impact of buildings through heating and cooling is to create constructions that provide the best opportunity to minimise the building loads.
Whether it be cooling or heating that dominates energy use (although heating predominates in the vast majority of the domestic and small commercial buildings in temperate zones such as the UK), one of the fundamental factors is the thermal transmittance, or ‘U value’, of the structures that make up the building envelope.
This CPD article will look at how this much-used value of thermal performance may actually vary in practice from the ‘standard’ calculated value.
The U value in context
In a building there will be a complex pattern of heat flows between not only the internal and external environment, but also between the walls, ceilings, floors, and so on, that make up the internal environmental space. Even in the simplest of buildings there is a requirement to examine the pattern of heat flows so that a proper judgement may be made on issues such as condensation risk, optimising insulation, heat emitter and plant sizing and increasingly as part of the information needed to model the energy use of the individual spaces and the complete building.
The U value is a measure of the ability for heat to flow from one space, through a solid structure, and into another space and assumes that the conditions stay the same both in the wall and in the spaces. It is used in both simple ‘steady state’ calculations – as would typically be employed to determine design heat losses, and in conjunction with other parameters (including principally the ‘admittance’, Y) when evaluating dynamic loads – as would be used for cooling loads when the indoor and outdoor conditions vary relatively quickly.
As the U value increases so does the potential for heat flow. And so, for example, in the England and Wales Building Regulations Approved Document Part L1A for houses, there are maximum acceptable ‘back stop’ values for the U-value of 0.3 W/m2K for external walls, 0.2 W/m2K for a roof and 2.0 W/m2K for windows. However the reality of the predicted U value is not always straightforward and can vary significantly from day to day, as well as over its lifetime. A U value can only be calculated if the materials and thicknesses are known and, importantly, the actual location of the complete structure. It’s orientation, whether it is horizontal or vertical, the speed of the air flowing across it and the potential for radiant heat exchange will affect the value. Most building structures are made from more than one layer, and normally from a variety of materials. Each of the layers will have its own thermal characteristics and, to determine the U value, the thermal conductivity and thickness of each individual layer will be required.
Thermal conductivity and thermal resistance
When considering solid materials, brick, plaster, insulation etc., the ease by which heat flows through is measured by its thermal conductivity, λ. If the temperatures on the two faces of a very large sheet of material are kept constant (but different from each other) then the heat flowing directly between the two faces as shown in Figure 1 will be
Q12=λ/d x A x (θ1 – θ2) watts, and where Q = heat flow (W), d = thickness (depth) of block (m), A = area of block (m2), θ = temperature of surface (°C) and λ = thermal conductivity (W/mK).
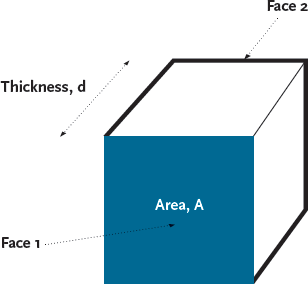
Figure 1: A section of a very large plane of material
The term λ/d is called the conductance (W/m2K), and the inverse, d/λ, is the resistance, R (m2K/W), with calculations of R to running to three decimal places when establishing the individual resistances of layers[1]. The R value is frequently used to publicise the insulating capacity of a material of a particular thickness such a insulation boards and mats.
The value of the conductivity for materials may be obtained from tables (that have themselves been developed from laboratory tests) such as those in CIBSE Guide A 2006 – Section 3. Materials with low values of thermal conductivity (below about 0.05 W/mK) being commonly referred to as ‘thermal insulation’
However, the value for the actual installed material will not necessarily be the same as the tabulated λ as it will be affected by its moisture content and, to an extent, its actual temperature.
Moisture content
In broad terms the thermal conductivity will relate to the density of a material. So intuitively a lightweight thermal block will be a better insulator than the common (dense) housebrick. This situation can change completely if the materials are allowed to absorb water, as might happen while stored on-site prior to construction. The air spaces will be filled by water, which is a relatively good conductor of heat, and the overall thermal conductivity of the material will be increased. In properly constructed buildings this excess water will dry out. However, where there is poor weathering, or insufficient protection from water rising from the ground, elements may hold large amounts of water, so increasing the conductivity and potentially having significant effects on heat flow through the associated structure. For example, the standard moisture content for a brick protected from the weather (for example, on the inside skin of a construction or covered by tiling) is taken as 1% (by volume) [2]. If subsequently that same brick is used in the outer face of a wall (or a protective covering fails in an existing wall) the moisture content may rise towards the standard ‘exposed’ value of 5%. Each additional % (by volume) of water content in a brick will increase the thermal conductivity by about 10%, and as in this case it would rise by 20%, so its thermal resistance would consequently fall. So for a 105mm lightweight clay brick with a protected λ of 0.40 W/mK, the R value would fall from (0.105/0.40) = 0.263m2K/W to (0.105/0.48) = 0.219m2K/W.
Where poor design, or extreme conditions, lead to condensation occurring in the structure, the water content of the materials will increase, so reducing the thermal resistance. This in turn is likely to exacerbate the condensation problem as it is likely to reduce the temperature of the fabric.
Temperature
The actual temperature of the material will also affect its thermal conductivity. In the range of temperatures typically used in buildings, the thermal conductivity will increase in most materials as temperature rises. Tabulated values of conductivity would normally be based on the material being at a temperature of 10°C. In most cases any variation from this reference temperature is ignored. However, where there are temperatures that significantly vary from 10°C, or for specific materials, there may be a case for examining the effect. The variation in the value of λ with temperature, θ, is difficult to generalise. However, there have been several studies that have measured the impact of temperature on thermal conductivity. For example a study[3] undertaken in Saudi Arabia measured the temperature effect on the thermal conductivity of a number of insulation materials. The results for rock wool are shown in Figure 2, and indicate an increase in thermal conductivity of more than 10% between the standard tabulated values at 10°C and those temperatures that may prevail when undertaking cooling load calculations.
.png)
Figure 2: The measured effect of temperature on thermal conductivity of rock wall at various densities
This magnitude of change is not uniform across all materials. Practical measurements of structural materials in Canada[4] indicated that some materials, such as (carbonate aggregate) concrete exhibited a significant change in conductivity with temperature, whereas lightweight bricks did not.
Heat flow to and from the structure
The heat will flow to and from a building and between its individual components by conduction, convection and radiation. And for heat to pass through the solid structures it must first enter the structure’s surface by heat conducting from the adjacent convecting air to the surface and from the radiant input from all of the surfaces facing it. When considering heat flow from outdoors, the radiant heat flow from the sun and the sky will also be included. For convenient incorporation into the U value calculation, the various heat transfer coefficients are combined to produce the internal surface resistance, Rsi, and external surface resistance Rse, (m2K/W).
So Rse = 1/ (hc + Ehr) and Rsi is = 1/ (1.2 Ehr + hc) where hc is the convective heat transfer coefficient, E is the emissivity factor (this takes account of the ability of the surface to radiate heat to its surroundings), and the radiative heat transfer coefficient, hr =4 σ Ts3 where σ is the Stefan Boltzman constant 5.67 x 10⁻⁸ W/m2K, and Ts is the surface absolute temperature (in Kelvin, K). The tables (3.8 and 3.9) in CIBSE Guide A 2006 for Rse and Rsi have been developed using these relationships.
Values of convective heat transfer wwere determined by Jürges in 1928 for forced convection (that is, external wind or caused by air movement devices in the room) and by McAdams in 1954 for free convection, and these still form the basis of the many tabulated values.
For the external convective heat transfer coefficient CIBSE Guide C 2007 suggests the use of the relationship[5] hc = 16.7cs0.5 W/m2K for the air velocity, cs being less than 3.5m/s. So, for example if the wind speed was 1.5m/s the value of hc would be 16.7 x 1.50.5 = 20.5W/m2K. If the wind speed subsequently increased to 3.5m/s the value of hc would increase to 31.24 W/m2K.
Radiation heat transfer will be dependant on the temperature of the object(s), the shape and emissivity. Typically dark objects will emit more radiation than lighter ones – they will have a higher emissivity and practically most building materials will have a high emissivity (with the maximum value being 1). However the emissivity of a surface will change as a material becomes coated in particles of soot and dust in the air. The relationships that define the radiant heat transfer from a surface are very complex (a good discussion is provided in CIBSE Guide C 2007) and the equations used have been simplified and generalised for conditions that would be typical in building constructions. The value of the radiative heat transfer coefficient hr is dependent on the relative temperature of the surface to its surroundings; however, to accurately predict variations in this is extremely complex.
The emissivity factor, E, will vary directly with the emissivity of the surface and so is more straightforward to enumerate. This can be illustrated most markedly when considering, for example, a bitumen flat roof that has been coated with aluminium paint (as a means of reducing solar gain) that, when freshly applied, would have an emissivity of around 0.3. As the roof ages and accumulates particles from pollution, flora and fauna its emissivity will rise, depending on the condition, towards the emissivity of the original dark bitumen roof (0.9) so increasing the radiant heat loss from the surface. The emissivity factor will also be significantly affected by the surrounding surfaces, as there will only be radiant heat flow from the surface if there is a suitable surface to absorb the radiation. (This receiving ‘surface’ may in practice be the massive heat sink of a very cold, clear night sky). Practically the radiant surroundings may change as vegetation alters around a building or adjacent buildings and landscaping are changed.
To combine the two effects of the variation of the values of hc and Ehr (simply to illustrate the point and not as a specific design example) the value of Rse for a 1.5 m/s air speed passing over the surface with an emissivity of 0.3 would be 0.045 m2K/W. For a 3.5 m/s air speed passing over that same surface with an emissivity of 0.8, the value of Rse would be 0.028 m2K/W. If the wind speed had stayed the same and the surface’s emissivity had risen to 0.8, the value of Rse would still have reduced to 0.039 m2K/W compared to the original value of 0.045 m2K/W.
Practical implications
This article has touched on some of the variables in the thermal performance of building constructions in use. Combined with the challenges of calculating a representative U value for building elements that are made of several layers of ‘non-homogenous’ (varying) materials means that a pragmatic approach to heat loss and energy calculations is required. No matter how ‘accurate’ the subsequent thermal model may be, there must be a realistic understanding that the underlying U value cannot be considered an absolute constant.
© Tim Dwyer
References
- BS EN ISO 6946:2007 Building components and building elements… Calculation method
- Table A3.2, CIBSE Guide A, 2006
- Abou A. Budawi,I. ‘Comparison of Thermal Conductivity Measurements of Building Insulation Materials under Various Operating Temperatures’, Journal of Building Physics, Vol. 29(2), October 2005
- Hu, T. Lie, G et al, Thermal Properties of Building Materials at Elevated Temperatures. National Research Council, Canada, 1993
- Loveday D L and Taki A H, ‘Outside surface resistance: proposed new value for building design’, Proc. CIBSE A: Building Serv. Eng. Res. Technol. 19(1) 23–29 (1998)